Fig. 3.
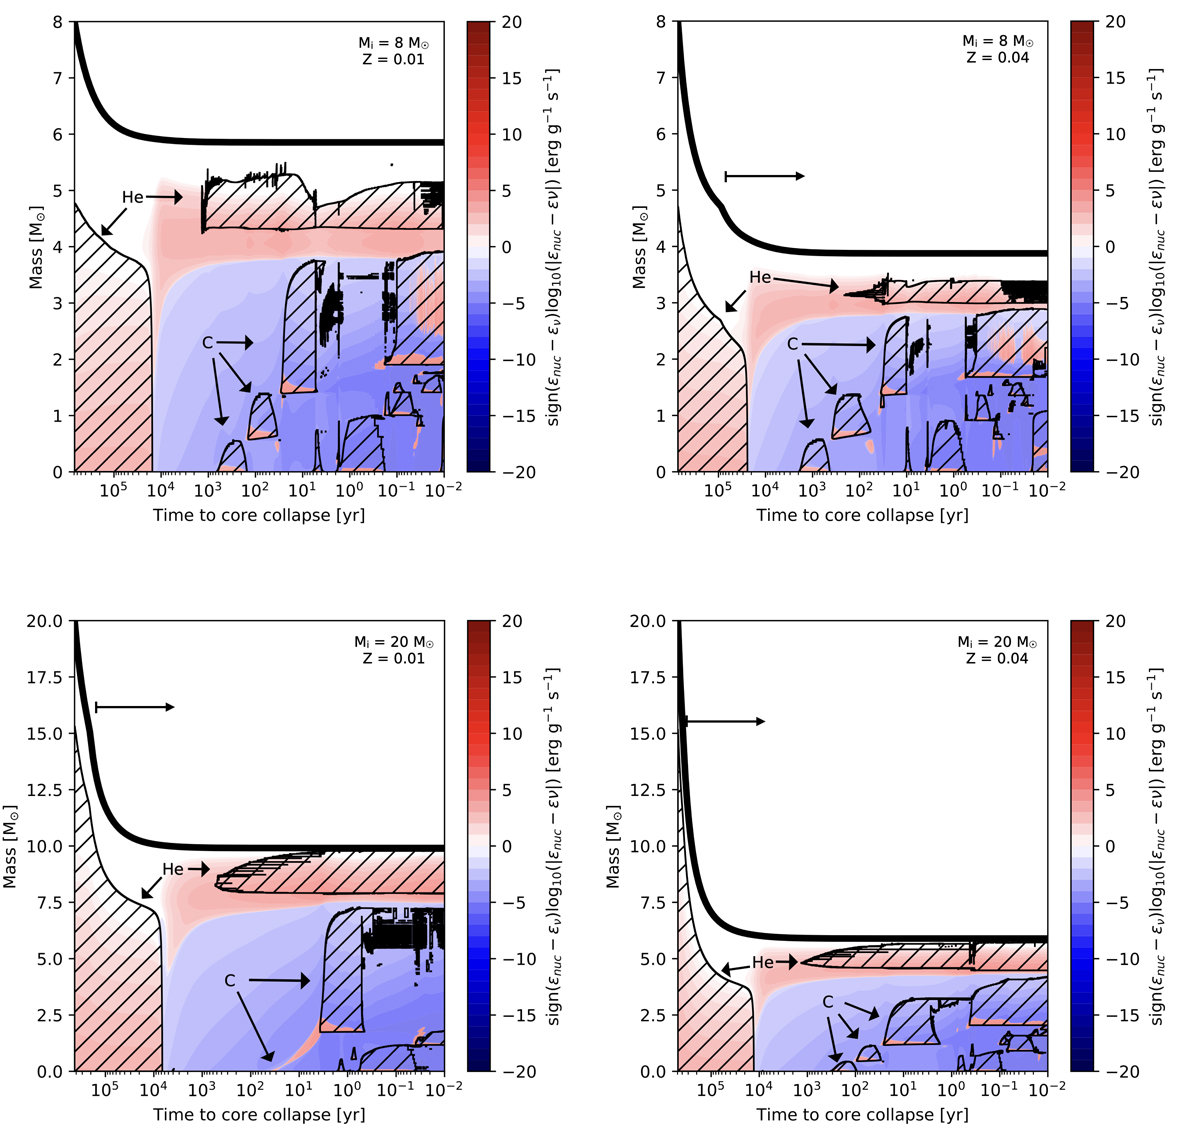
Download original image
Kippenhahn diagrams following the energy generation and loss rates and the structure of convective regions as a function of time remaining until core collapse, from core helium burning until a few days before core collapse. Represented are the evolutionary calculations with initial helium star masses of 8 (top) and 20 (bottom) M⊙, with metallicities of Z = 0.01 (left) and Z = 0.04 (right). The colour denotes the intensity of the energy generation (red) and loss (blue) rate. The hatched regions denote convective regions. The helium and carbon burning regions are indicated with arrows. The point where the products of helium burning are exposed at the surface, and the model transitions from WN to WC mass loss rates are indicated with horizontal arrows.
Current usage metrics show cumulative count of Article Views (full-text article views including HTML views, PDF and ePub downloads, according to the available data) and Abstracts Views on Vision4Press platform.
Data correspond to usage on the plateform after 2015. The current usage metrics is available 48-96 hours after online publication and is updated daily on week days.
Initial download of the metrics may take a while.