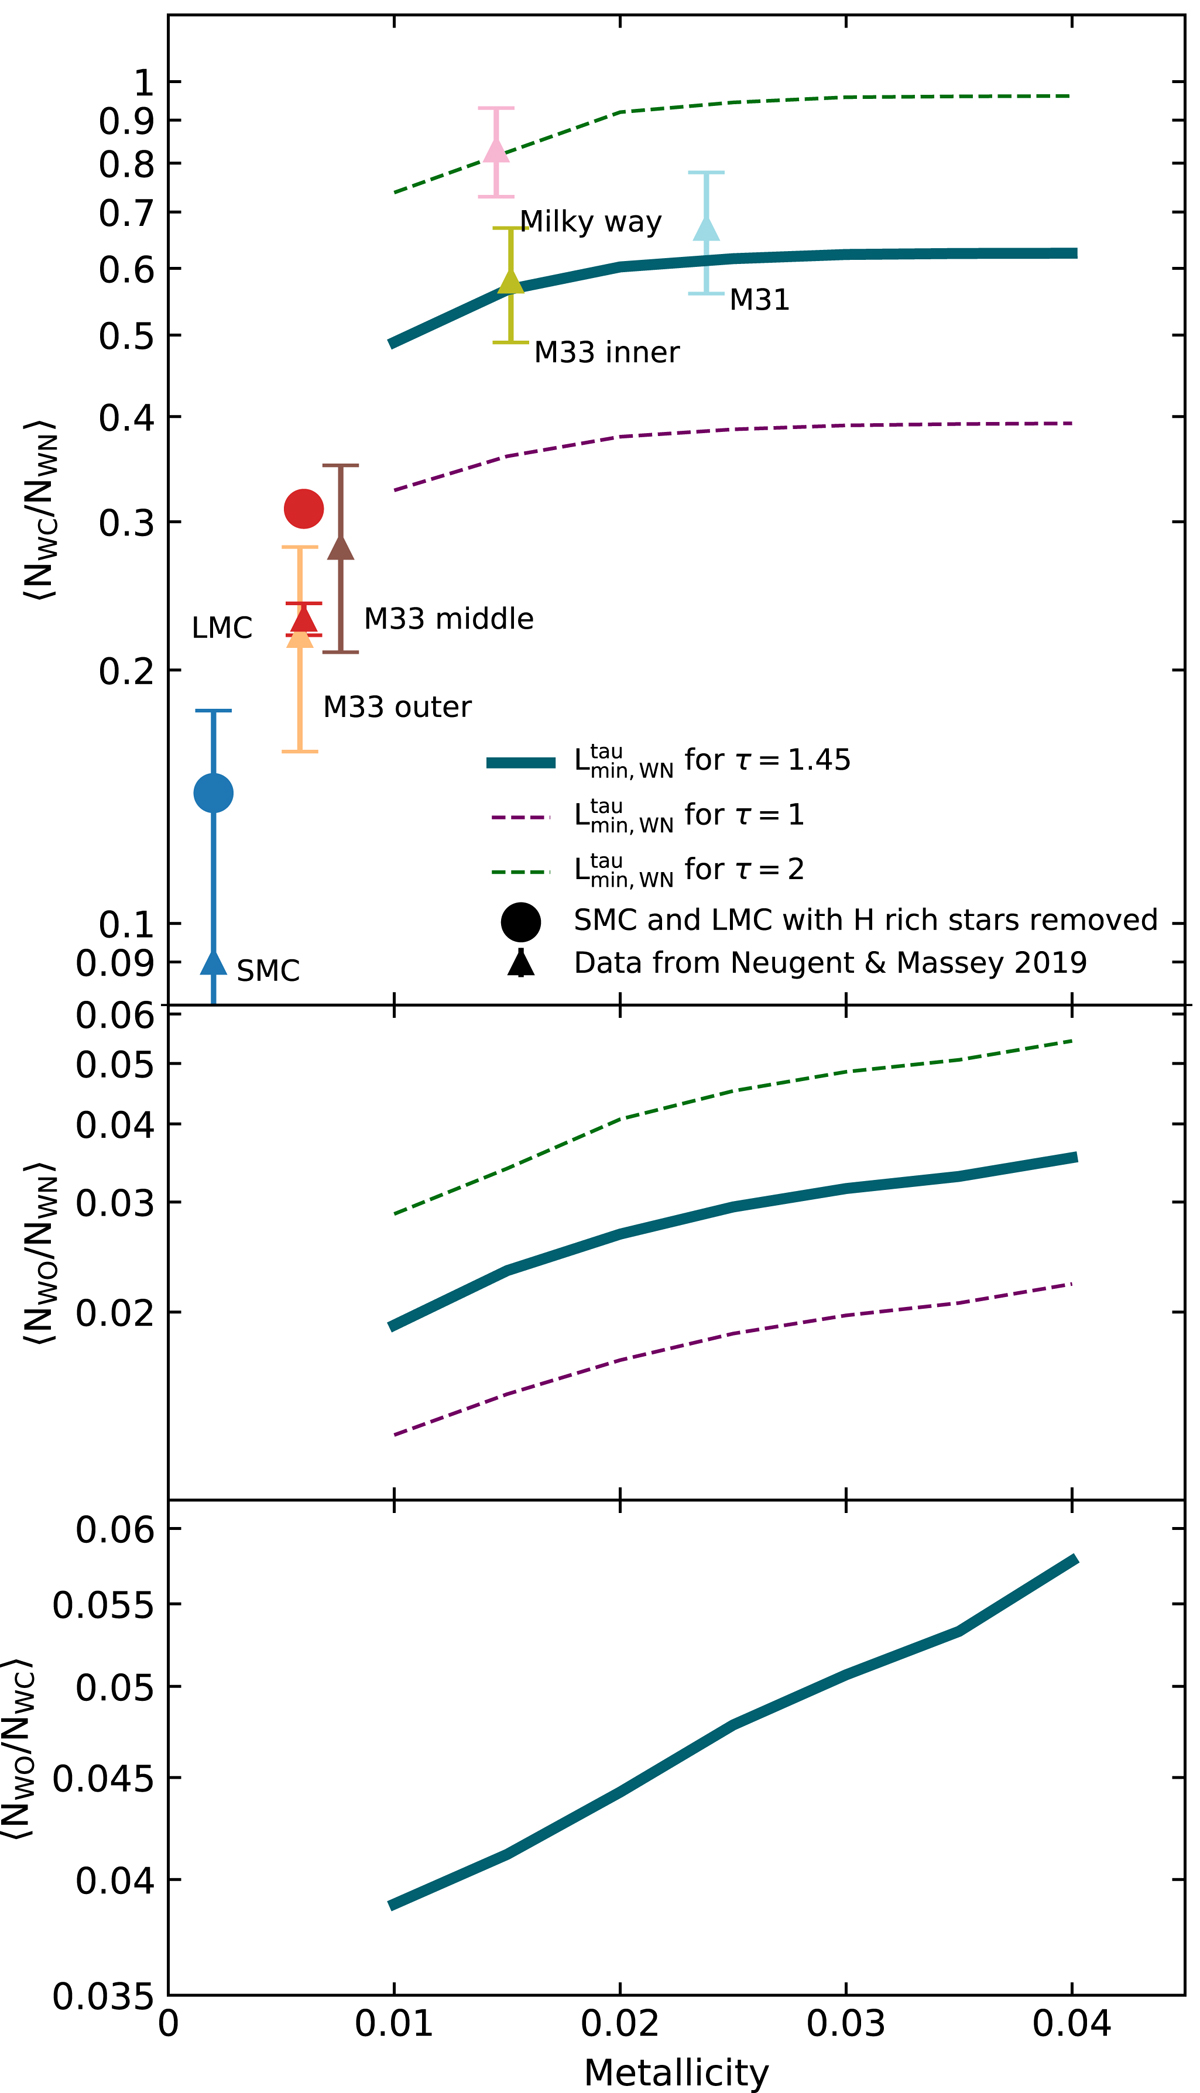
Fig. 10.
Download original image
Average number ratio of WC to WN stars (top panel), WO to WN stars (middle panel), and WO to WC stars (bottom panel) as a function of metallicity, as predicted from our models (solid lines). This quantity strongly depends on the minimum mass for a star to be observable as a WR. The different lines in the top and middle panels correspond to employing different values of the minimum mass of WN stars, found adopting different values of wind optical depth for the transition between WN stars and transparent wind stripped-envelope stars. The solid line corresponds to the fit to observations in Eq. (7), adopting τ = 1.45 (blue). The dashed lines are calculated adopting τ = 1 (purple) and τ = 2 (green). Data shown in triangles correspond to the observed ratios of Neugent & Massey (2019), and are lower limits due to the inclusion of hydrogen-rich WN stars. Data shown in circles for the LMC and SMC correspond to the same ratio, with WN stars with XH > 0.3 removed (according to the analyses of Hainich et al. 2014 for the LMC, and Hainich et al. 2015; Shenar et al. 2016 for the SMC).
Current usage metrics show cumulative count of Article Views (full-text article views including HTML views, PDF and ePub downloads, according to the available data) and Abstracts Views on Vision4Press platform.
Data correspond to usage on the plateform after 2015. The current usage metrics is available 48-96 hours after online publication and is updated daily on week days.
Initial download of the metrics may take a while.