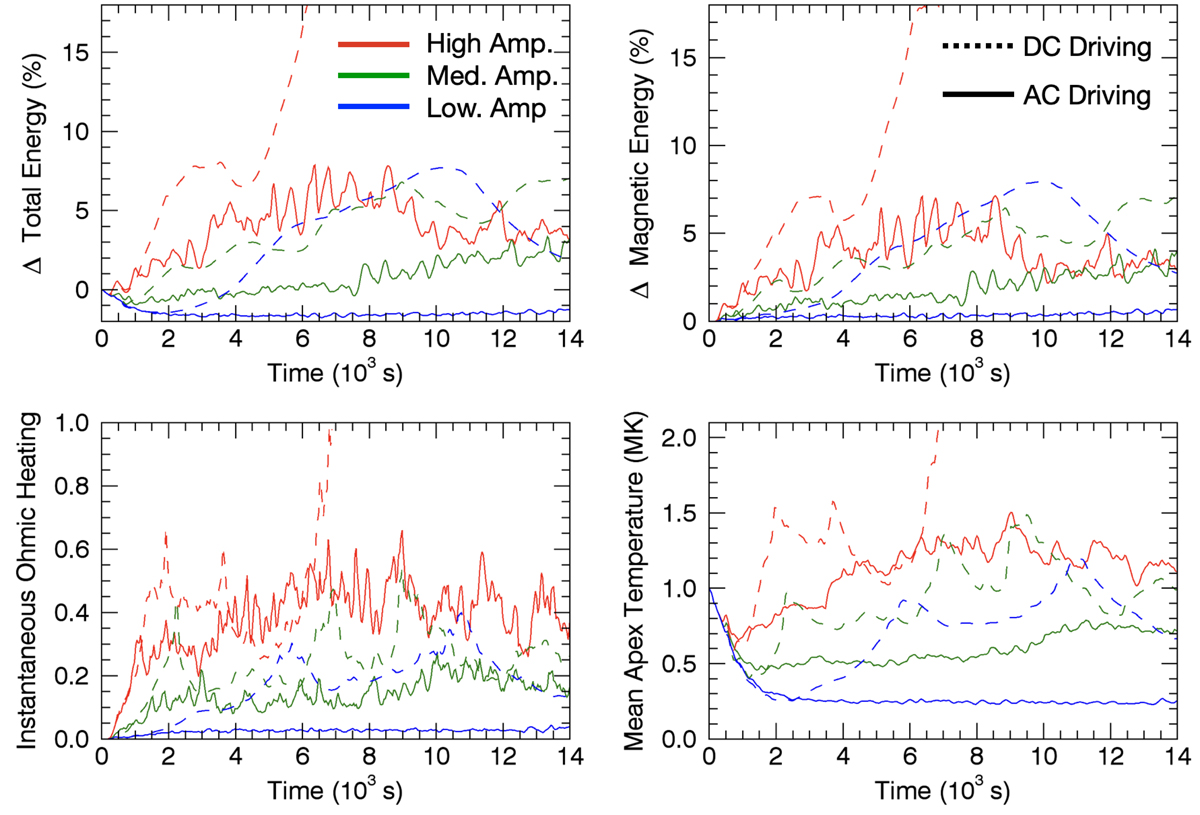
Fig. 8.
Download original image
Volume integrated quantities for all six simulations. In the upper two panels, we show the change in the volume integrated total energy (left) and magnetic energy (right). In both cases, we show the percentage relative to the initial total energy. We also show the volume integrated Ohmic heating (lower left), normalised to the maximum rate in the high amplitude, DC simulation. Finally, we show the maximum temperature at z = 0 in the lower right panel. In all figures, solid lines refer to AC cases and dashed lines refer to DC cases. Each colour refers to a different driver amplitude.
Current usage metrics show cumulative count of Article Views (full-text article views including HTML views, PDF and ePub downloads, according to the available data) and Abstracts Views on Vision4Press platform.
Data correspond to usage on the plateform after 2015. The current usage metrics is available 48-96 hours after online publication and is updated daily on week days.
Initial download of the metrics may take a while.