Fig. 4.
Download original image
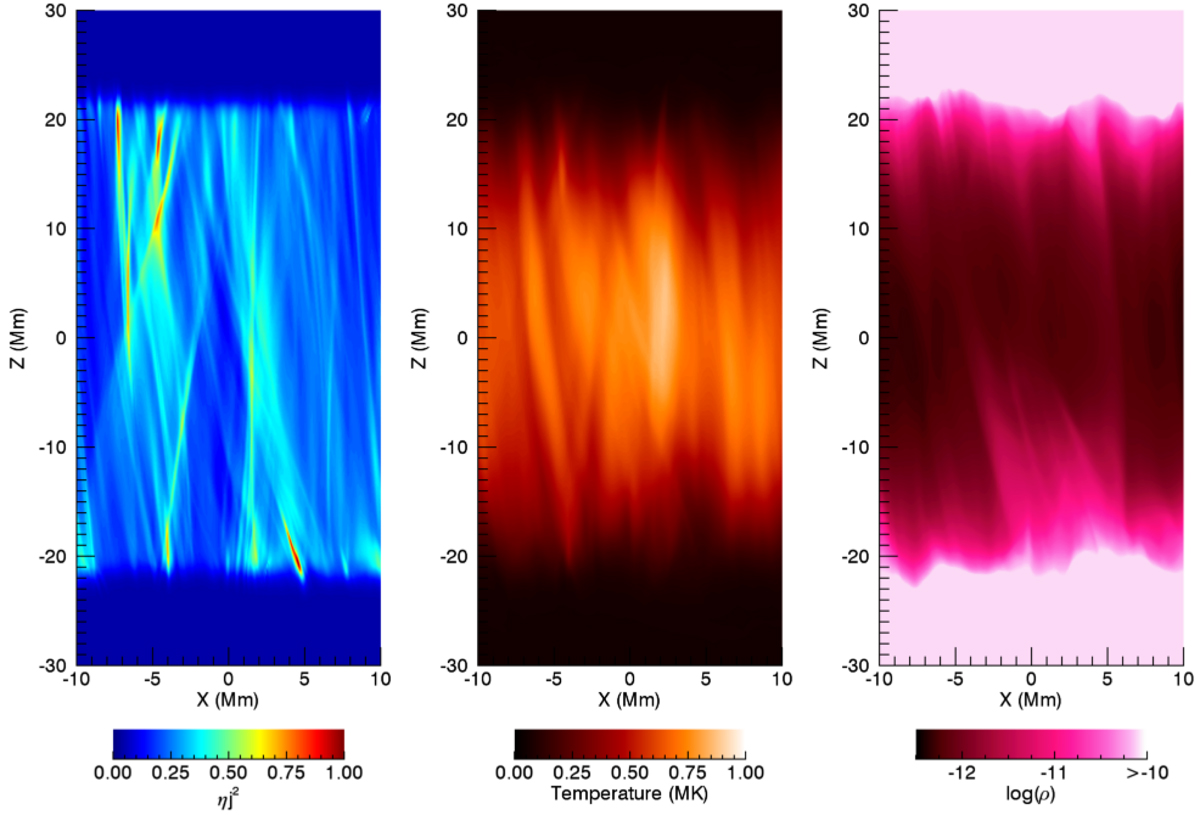
The Ohmic heating (ηj2; left), temperature (centre) and density (right) averaged in y and shown as a function of x and z. For the density, the logarithm is plotted and the colour bar is saturated at 10−10 kg m−3 in order to show the details of coronal structures. The panels shown here correspond to the medium amplitude AC simulation.
Current usage metrics show cumulative count of Article Views (full-text article views including HTML views, PDF and ePub downloads, according to the available data) and Abstracts Views on Vision4Press platform.
Data correspond to usage on the plateform after 2015. The current usage metrics is available 48-96 hours after online publication and is updated daily on week days.
Initial download of the metrics may take a while.