Free Access
Fig. 3.
Download original image
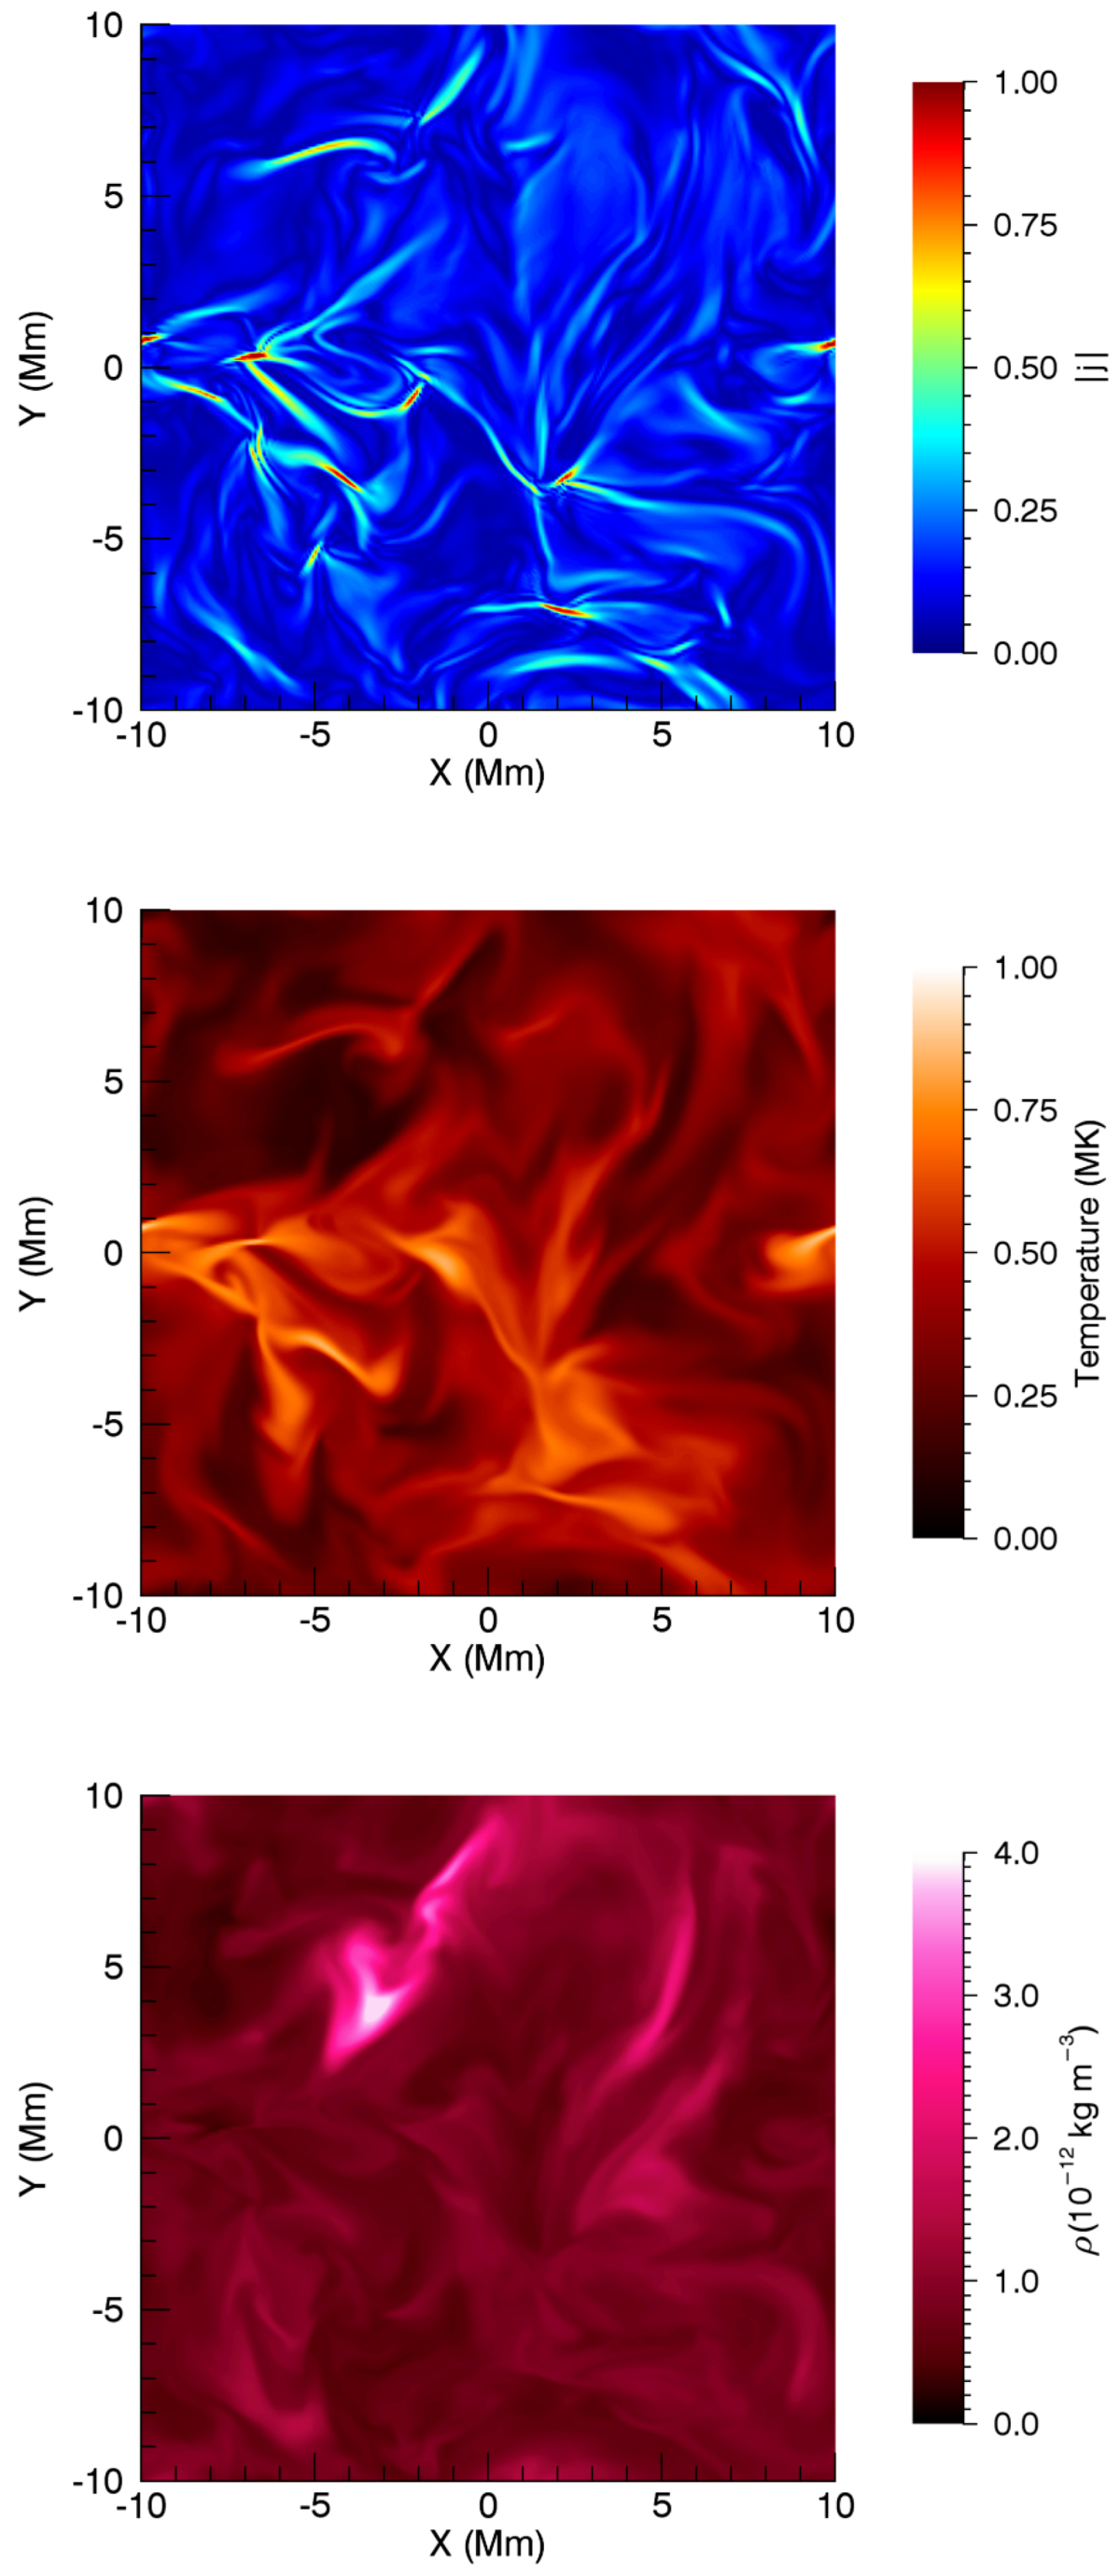
Horizontal cuts of the modulus of the current density, the temperature and the density at t = 10 900 s in the medium amplitude AC simulation. We have normalised the current to the maximum value in this plane. The temporal evolution of this figure is shown in a movie that accompanies this article.
Current usage metrics show cumulative count of Article Views (full-text article views including HTML views, PDF and ePub downloads, according to the available data) and Abstracts Views on Vision4Press platform.
Data correspond to usage on the plateform after 2015. The current usage metrics is available 48-96 hours after online publication and is updated daily on week days.
Initial download of the metrics may take a while.