Fig. 2.
Download original image
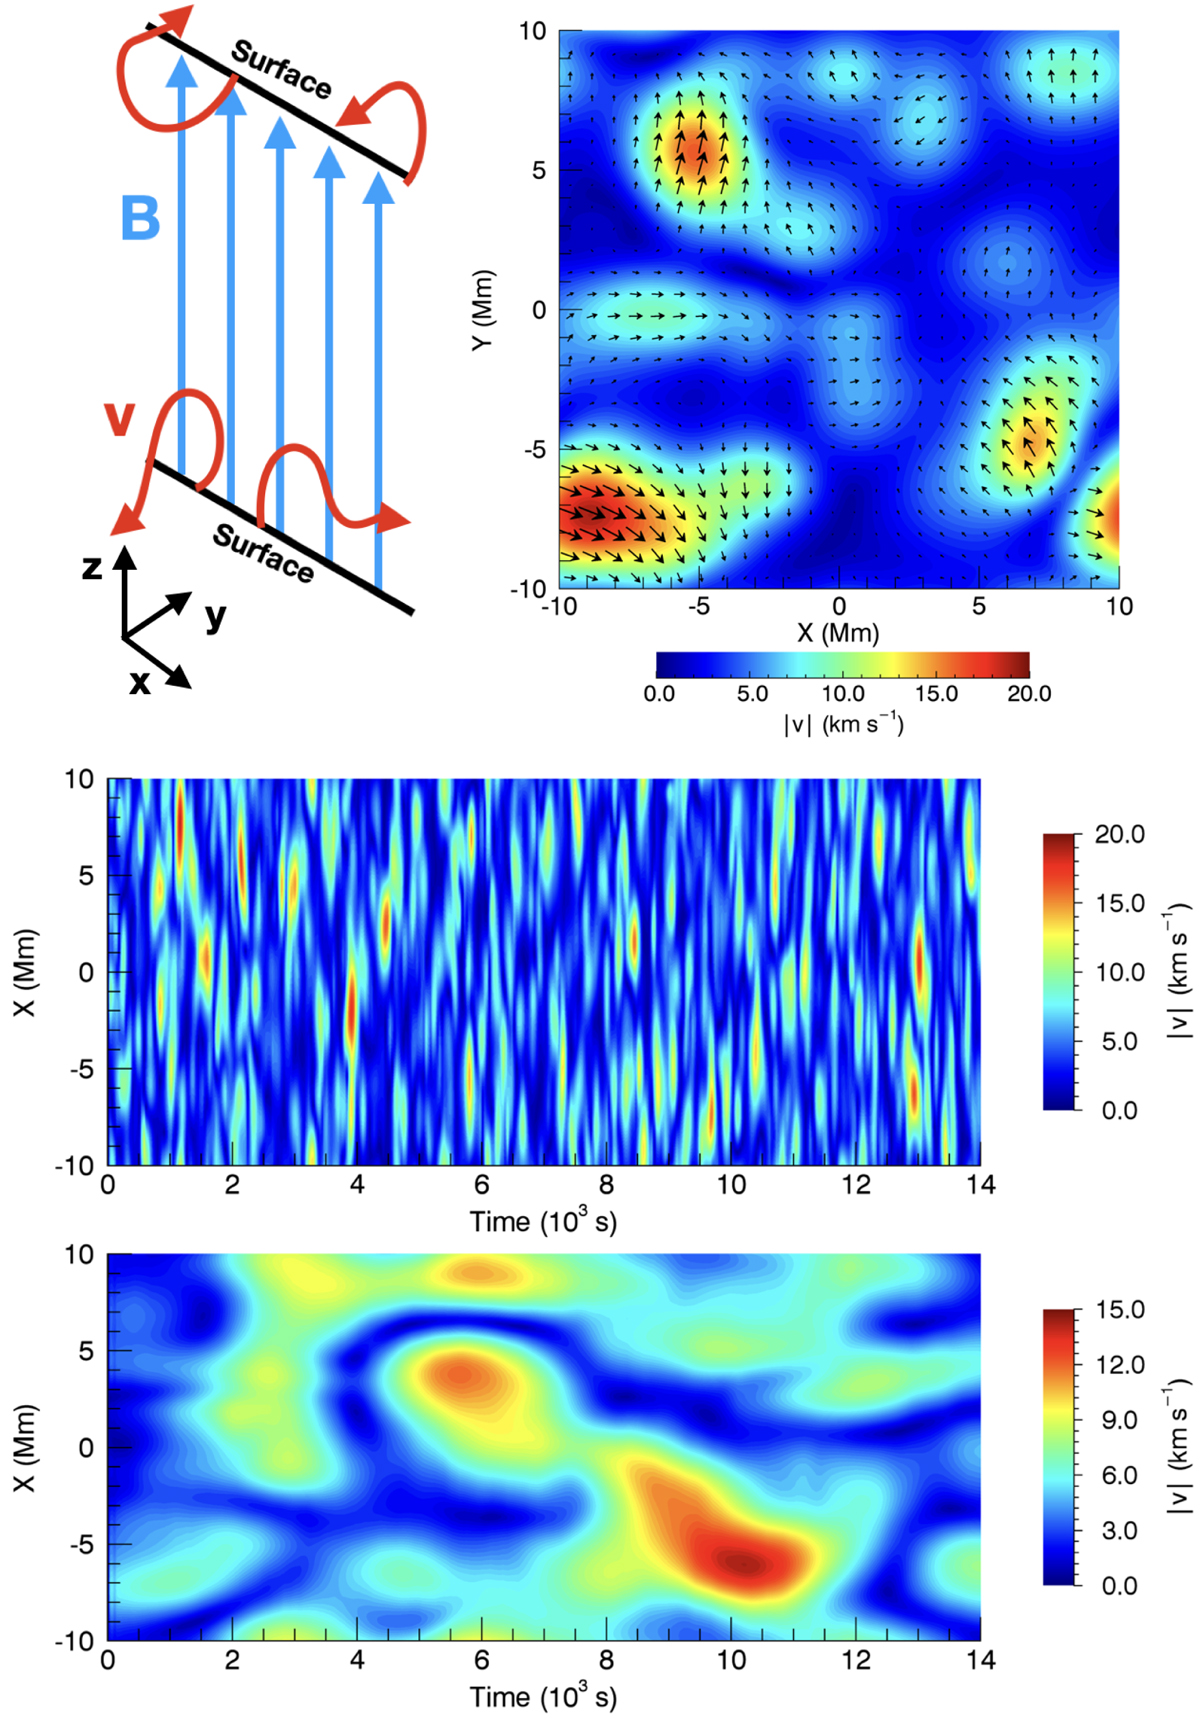
Imposed velocity drivers. Upper left: schematic of the drivers imposed on each of the foot points of magnetic field lines. Upper right: imposed velocity field on the lower boundary of the medium amplitude AC simulation. Centre: temporal evolution of the magnitude of the imposed driver on the lower boundary of the medium amplitude AC simulation on the line y = 0 Mm. Lower: temporal evolution of the magnitude of the imposed driver on the lower boundary of the medium amplitude DC simulation on the line y = 0 Mm.
Current usage metrics show cumulative count of Article Views (full-text article views including HTML views, PDF and ePub downloads, according to the available data) and Abstracts Views on Vision4Press platform.
Data correspond to usage on the plateform after 2015. The current usage metrics is available 48-96 hours after online publication and is updated daily on week days.
Initial download of the metrics may take a while.