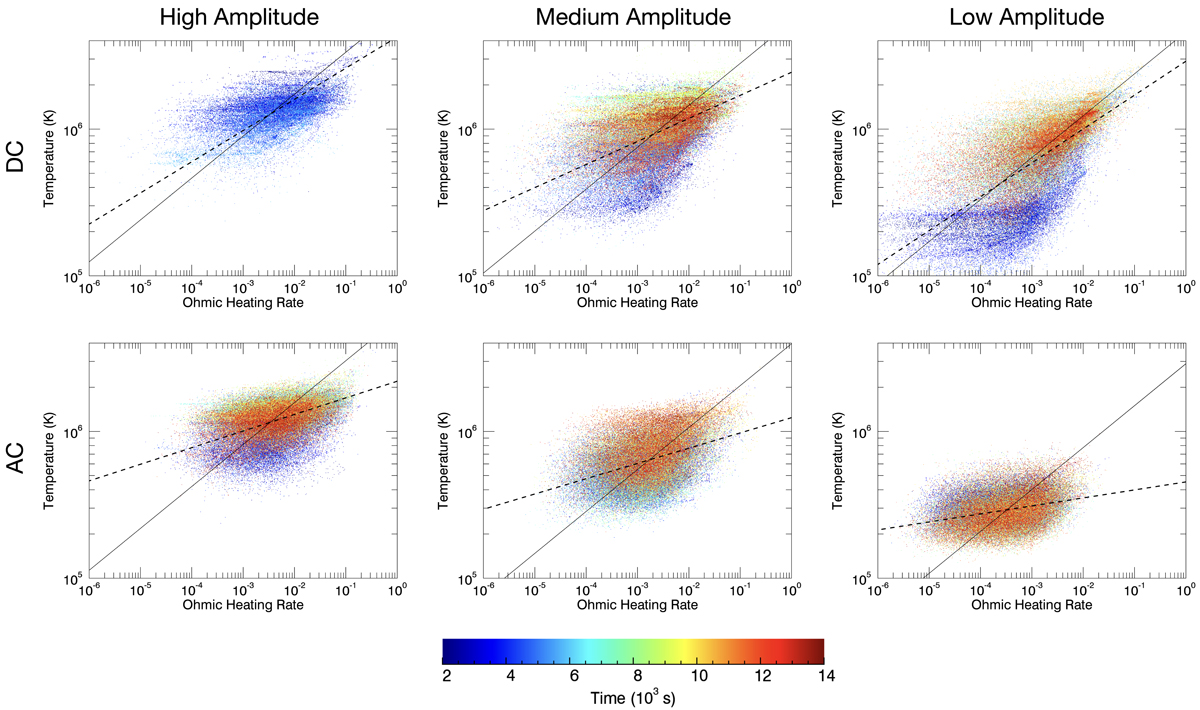
Fig. 13.
Download original image
Maximum temperature against the integrated Ohmic heating rate along the length of each field line. The heating rate is normalised to the maximum observed in the high amplitude DC simulation. Each panel shows the results of a different simulation. Individual points each show different field lines and the colour shows the simulation time when the field line was traced. Solid lines show the expected scaling law assuming thermodynamic equilibrium. Dashed lines show the scaling measured in each simulation.
Current usage metrics show cumulative count of Article Views (full-text article views including HTML views, PDF and ePub downloads, according to the available data) and Abstracts Views on Vision4Press platform.
Data correspond to usage on the plateform after 2015. The current usage metrics is available 48-96 hours after online publication and is updated daily on week days.
Initial download of the metrics may take a while.