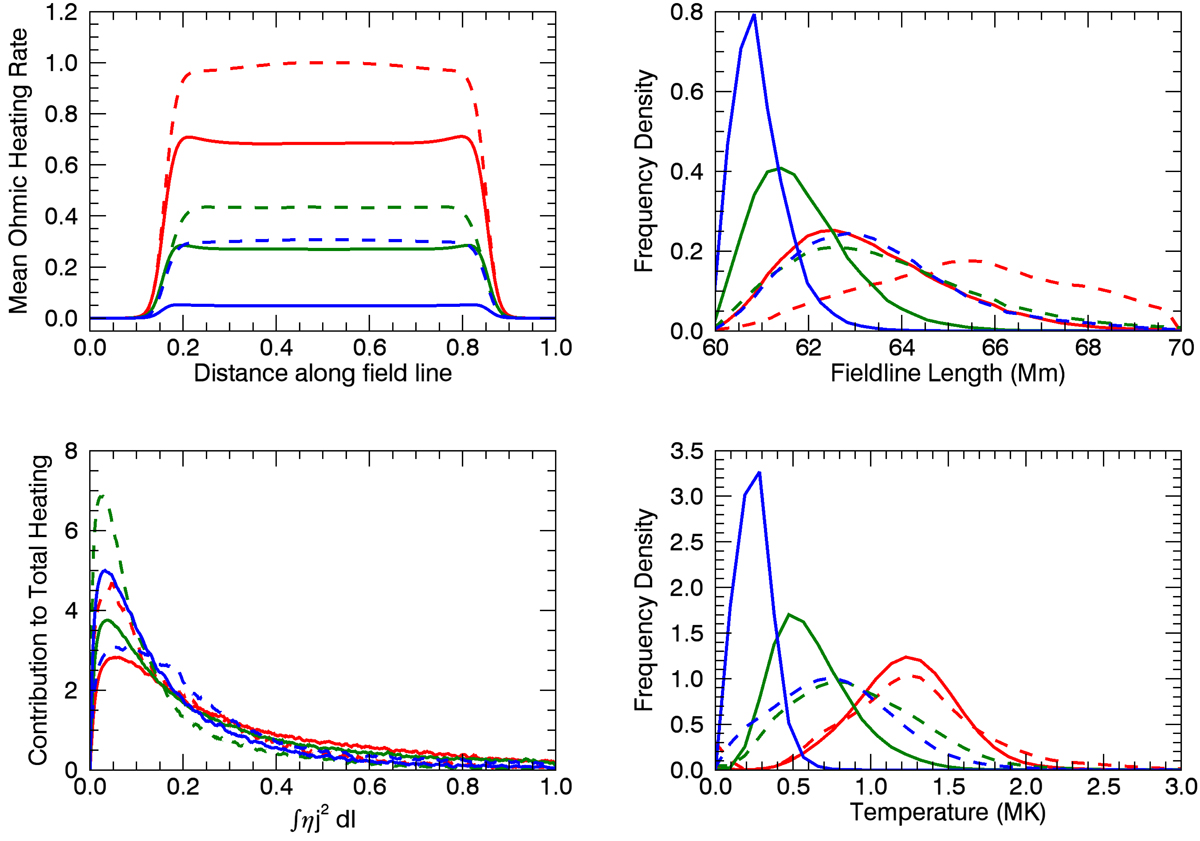
Fig. 12.
Download original image
Properties of field lines sampled from all six simulations. Upper left: the mean Ohmic heating rate along field lines. Upper right: the distribution of field line lengths. Lower left: the contribution of field lines with different Ohmic heating rates to the total energy release. Lower right: the distribution of field line temperatures. In the upper left panel, curves are normalised to the maximum of the dashed red line. The lines in all other panels are normalised such the area under each curve is unity.
Current usage metrics show cumulative count of Article Views (full-text article views including HTML views, PDF and ePub downloads, according to the available data) and Abstracts Views on Vision4Press platform.
Data correspond to usage on the plateform after 2015. The current usage metrics is available 48-96 hours after online publication and is updated daily on week days.
Initial download of the metrics may take a while.