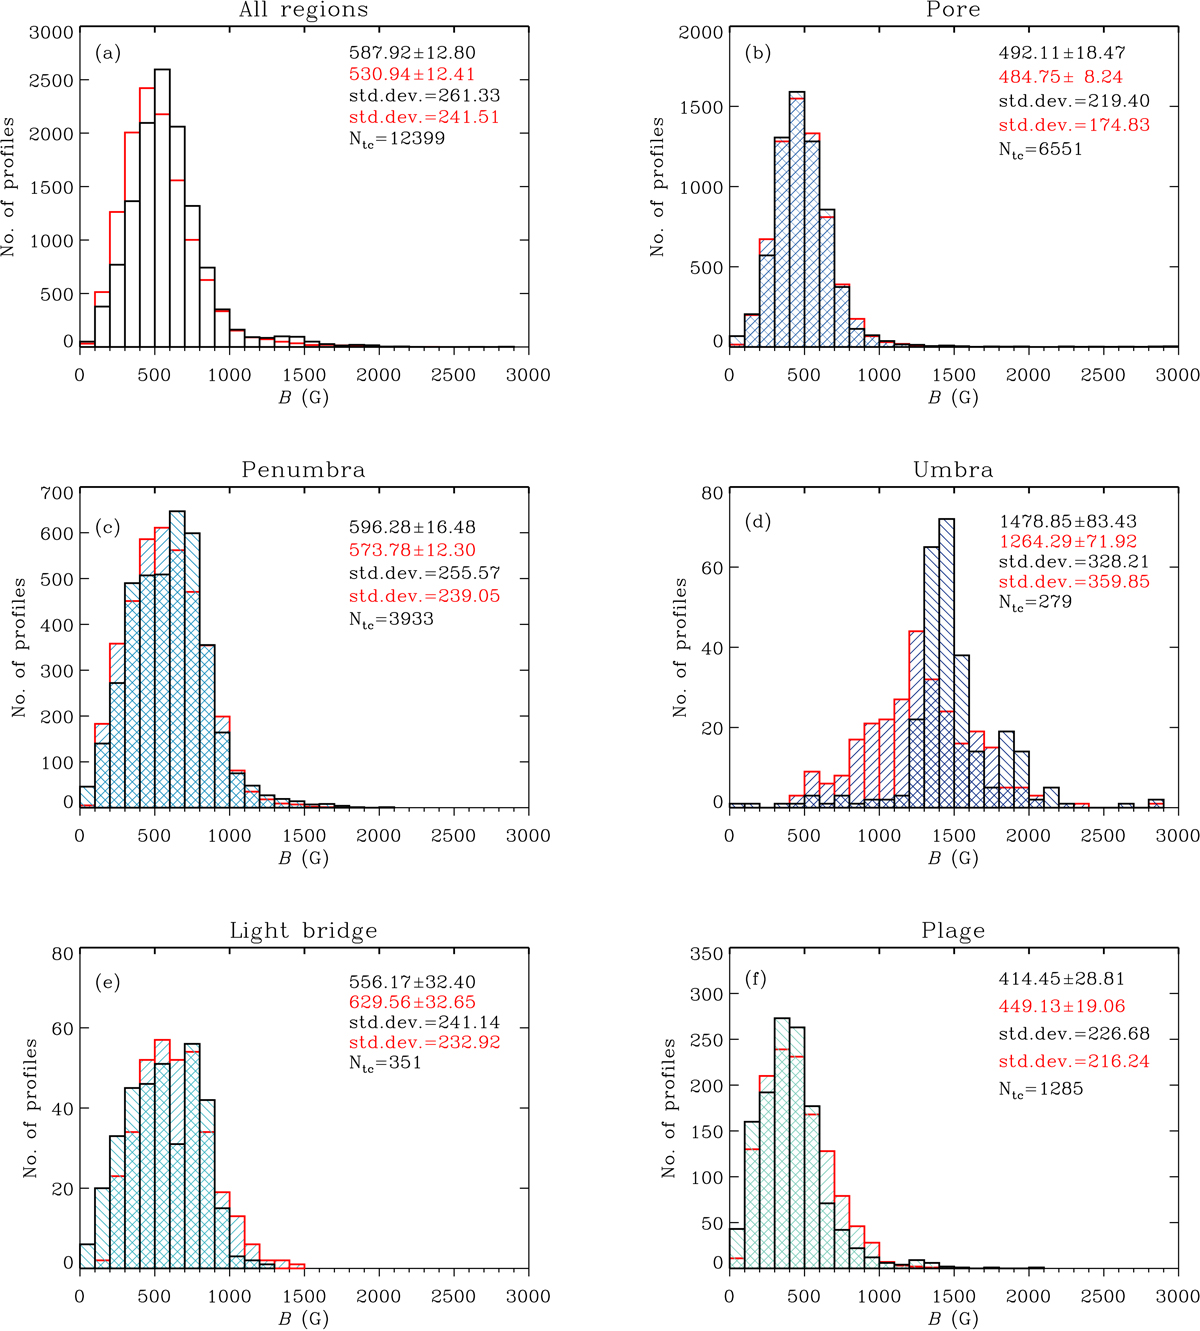
Fig. 8.
Download original image
Magnetic field strength distributions for the slow component (histograms outlined in black) and fast component (histograms outlined in red) for all of the 14 data sets (panel a), pores (panel b), sunspot penumbrae (panel c), sunspot umbrae (panel d), light bridges (panel e), and plages (panel f). We note that only those profiles that exhibit both slow and fast components are counted. “Ntc” is the number of profiles in each category where the supersonic downflow exists with a slow component. The numbers indicate the mean, uncertainty in the mean, and standard deviations of distributions, in G, for slow (black) and fast (red) components.
Current usage metrics show cumulative count of Article Views (full-text article views including HTML views, PDF and ePub downloads, according to the available data) and Abstracts Views on Vision4Press platform.
Data correspond to usage on the plateform after 2015. The current usage metrics is available 48-96 hours after online publication and is updated daily on week days.
Initial download of the metrics may take a while.