Fig. 7.
Download original image
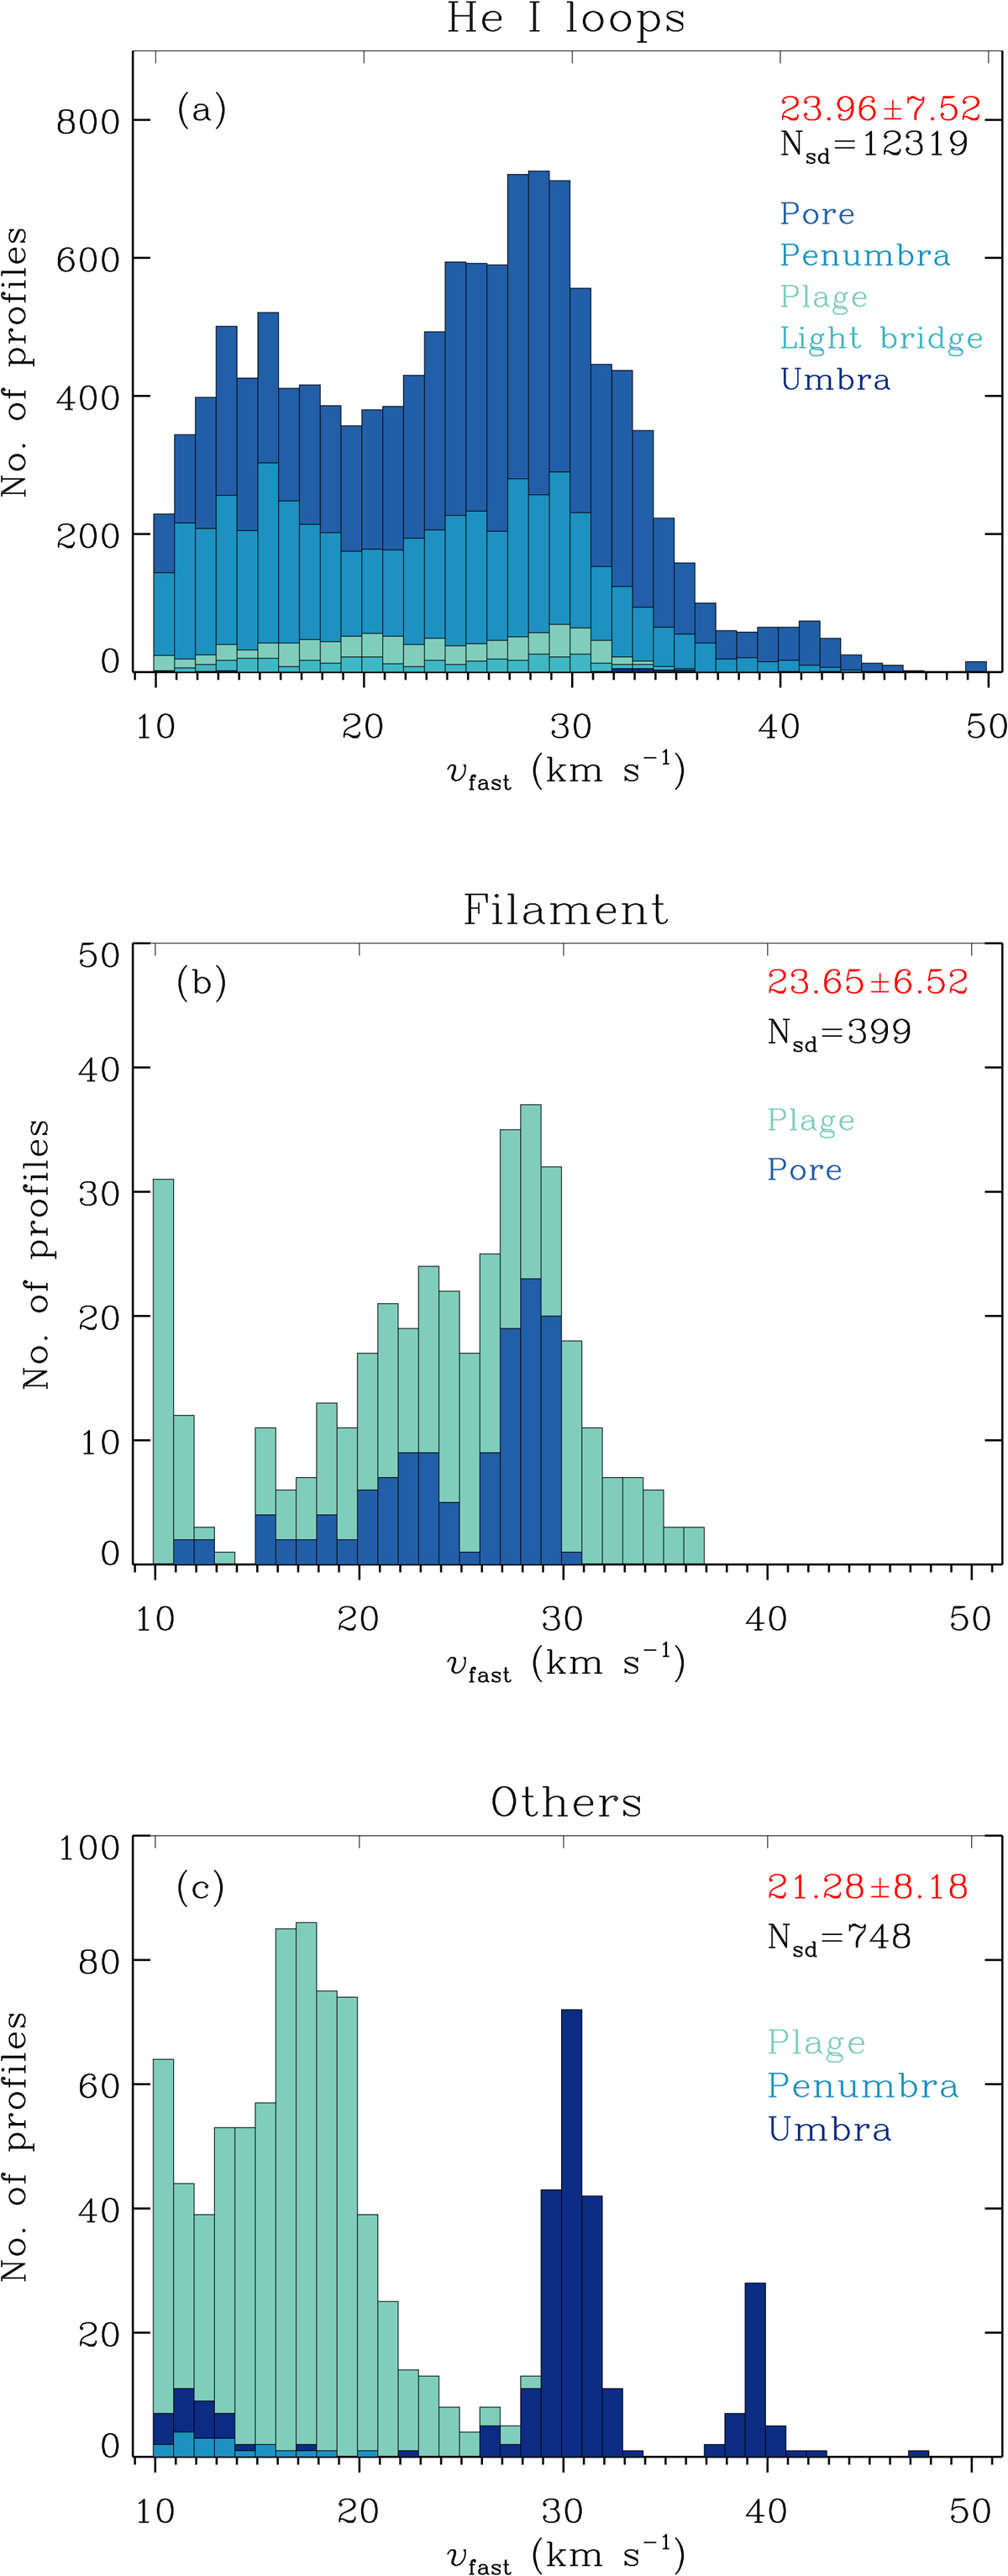
LOS velocity distribution of the magnetized supersonic downflows in He I loops (panel a) and filaments (panel b) and those for which the origin is not clear when considering the He Ic line core images (panel c). The contribution of the photospheric features to each of the chromospheric categories are shown. “Nsd” is the number of supersonic downflow profiles in each category. The numbers in red are the mean and standard deviations of the distributions, in km s−1.
Current usage metrics show cumulative count of Article Views (full-text article views including HTML views, PDF and ePub downloads, according to the available data) and Abstracts Views on Vision4Press platform.
Data correspond to usage on the plateform after 2015. The current usage metrics is available 48-96 hours after online publication and is updated daily on week days.
Initial download of the metrics may take a while.