Fig. 6.
Download original image
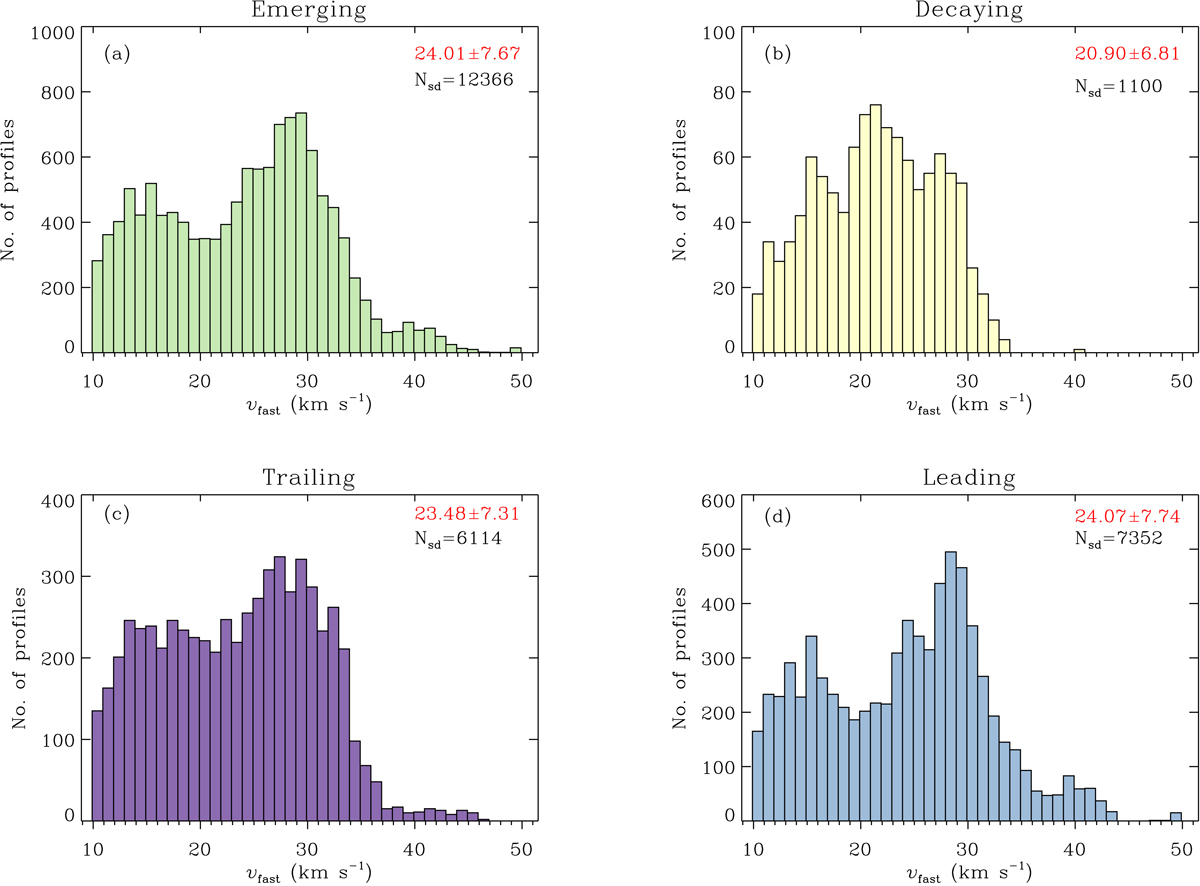
Distribution of the LOS velocities of supersonic downflows in EARs (panel a), DARs (panel b), trailing (panel c), and leading (panel d) groups (see Table 1). The mean values and standard deviations of the distributions are given in red. “Nsd” is the total number of profiles that exhibit supersonic downflows in each of the groups.
Current usage metrics show cumulative count of Article Views (full-text article views including HTML views, PDF and ePub downloads, according to the available data) and Abstracts Views on Vision4Press platform.
Data correspond to usage on the plateform after 2015. The current usage metrics is available 48-96 hours after online publication and is updated daily on week days.
Initial download of the metrics may take a while.