Fig. 5.
Download original image
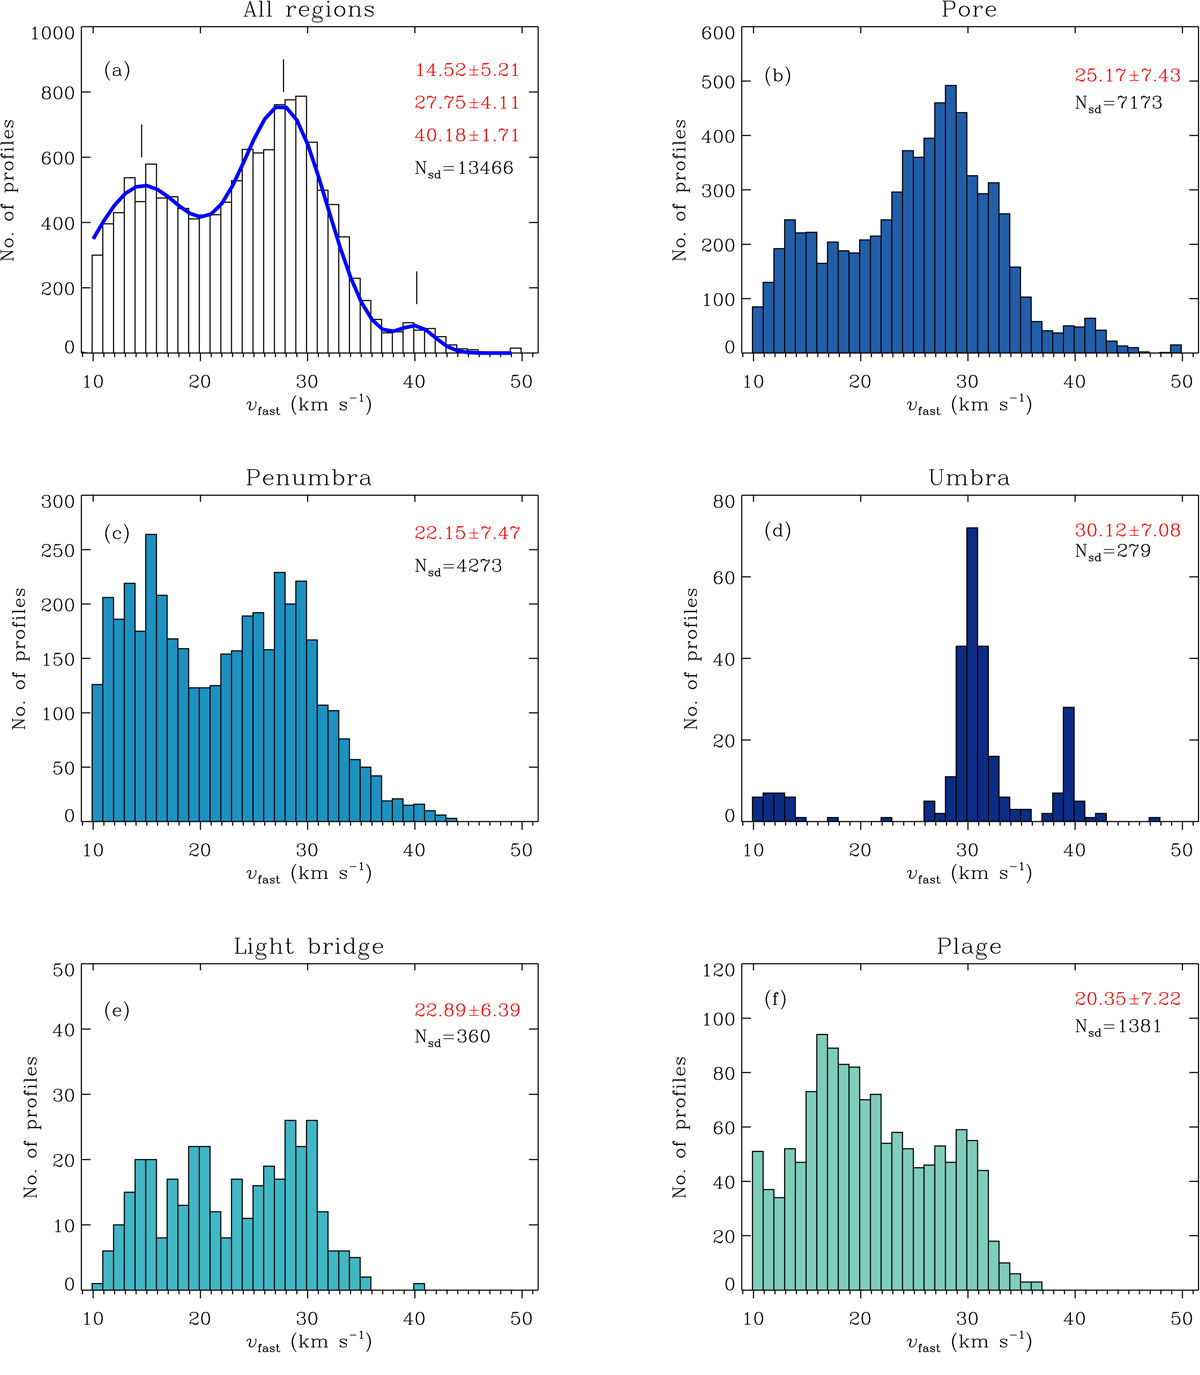
LOS velocity distribution of the magnetized supersonic downflows for all of the 14 data sets (panel a), pores (panel b), sunspot penumbrae (panel c), sunspot umbrae (panel d), light bridges (panel e), and plages (panel f). “Nsd” is the number of supersonic downflow profiles in each category. The numbers in red are the mean and standard deviations of the distributions, in km s−1. The blue curve in panel a is the triple-Gaussian fit to the velocity distribution. The vertical solid black lines mark the peaks of this triple distribution.
Current usage metrics show cumulative count of Article Views (full-text article views including HTML views, PDF and ePub downloads, according to the available data) and Abstracts Views on Vision4Press platform.
Data correspond to usage on the plateform after 2015. The current usage metrics is available 48-96 hours after online publication and is updated daily on week days.
Initial download of the metrics may take a while.