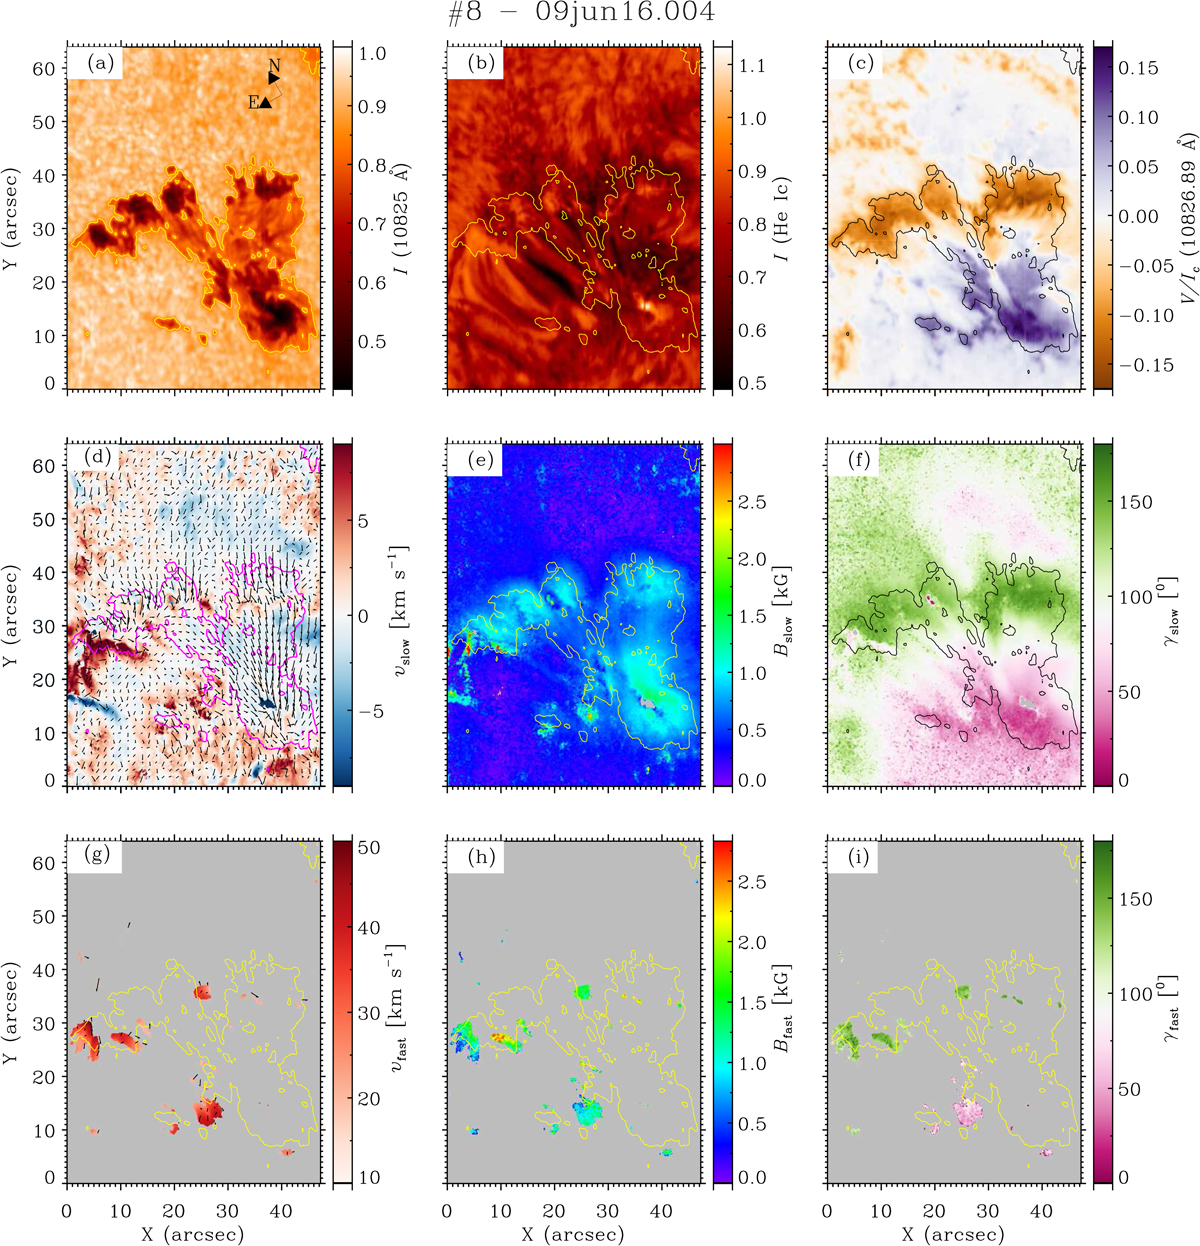
Fig. 3.

Download original image
Results of the two-component inversions of the He I lines for AR 12552 observed on 09 June 2016 (data set 8). Panels a–c: normalized intensity at 10 825 Å, the normalized intensity at the He Ic line center, and the Stokes V/Ic signal at 10 826.89 Å, respectively. The LOS velocity, the magnetic field strength, and the LOS inclination of the magnetic field are presented in panels d–f for the slow component and in panels g–i for the supersonic component. The contours mark the boundaries of sunspots and pores, determined using the continuum intensity image shown in panel a. These contours enclose regions within the 85% level of the surrounding quiet Sun intensity in the continuum image. The arrows in panel a indicate solar north and east. The azimuths of the magnetic field are overplotted as lines in panels d and g. See Sect. 3 for further details.
Current usage metrics show cumulative count of Article Views (full-text article views including HTML views, PDF and ePub downloads, according to the available data) and Abstracts Views on Vision4Press platform.
Data correspond to usage on the plateform after 2015. The current usage metrics is available 48-96 hours after online publication and is updated daily on week days.
Initial download of the metrics may take a while.


