Fig. A.1.
Download original image
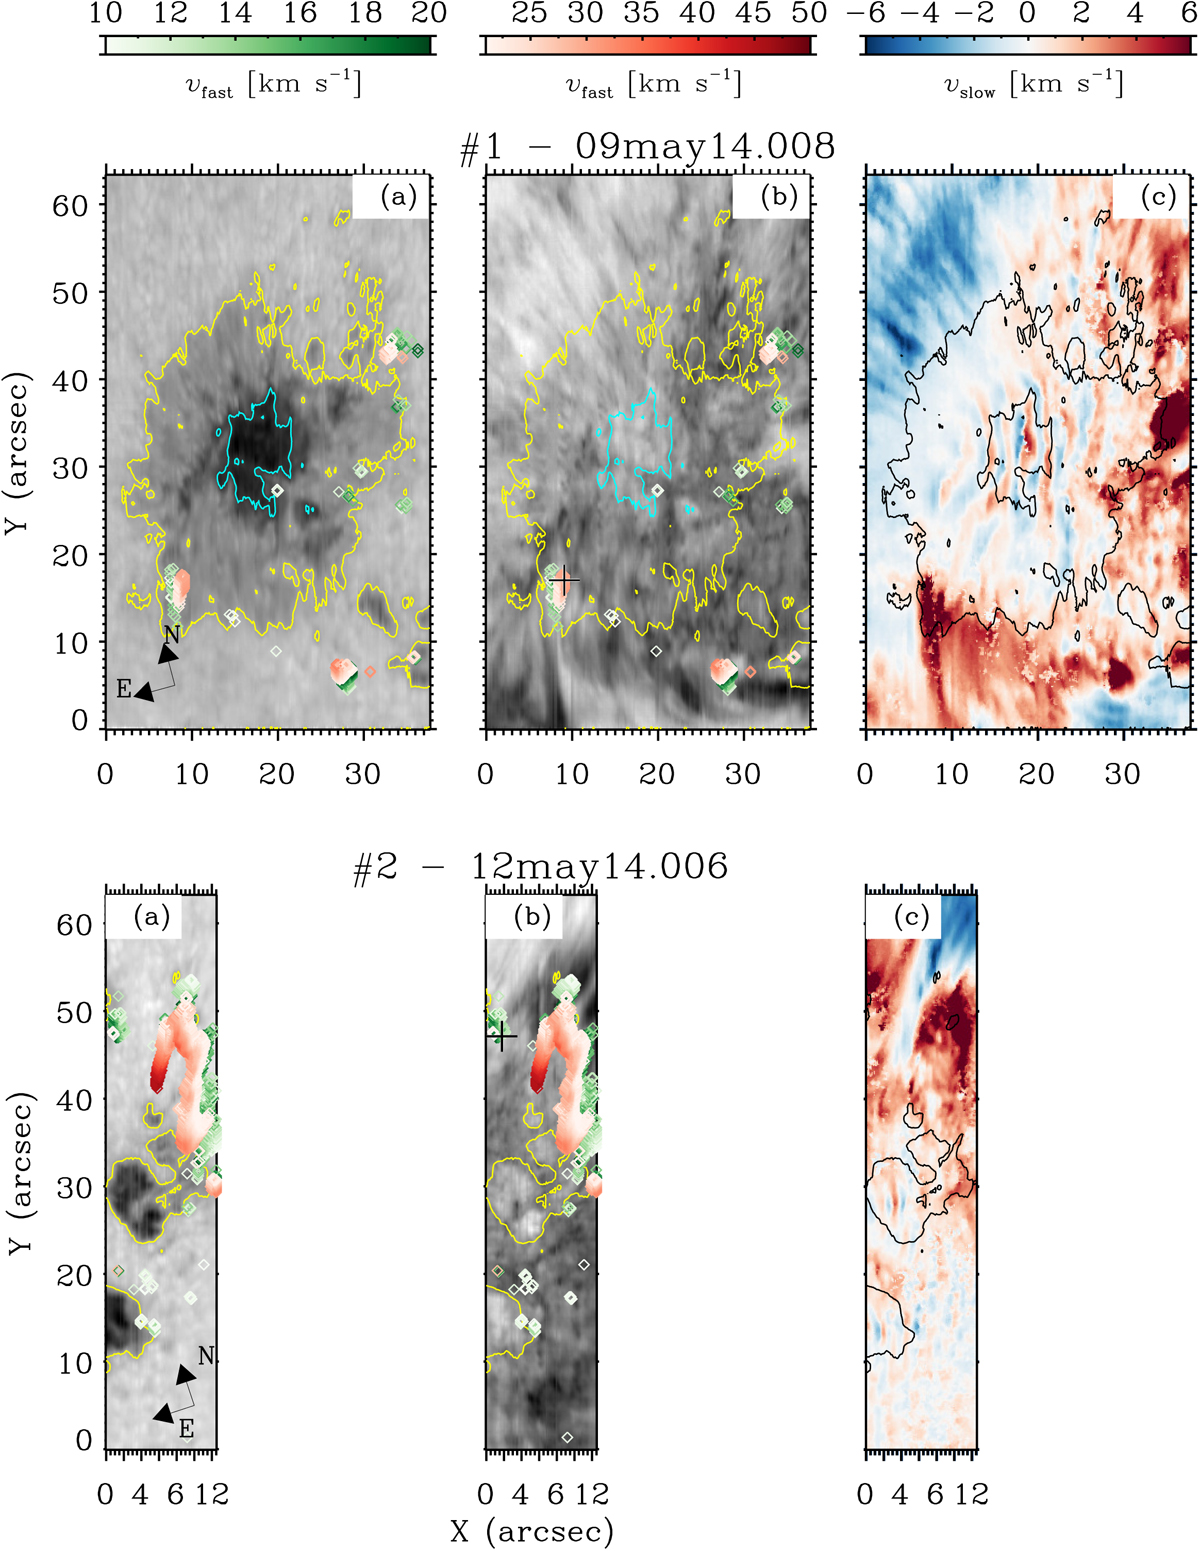
Overview of the ARs scanned in data sets 1 − 2 as indicated in the titles (see Table 1). Shown are maps of the normalized intensities at 10825 Å (panels a), normalized intensities at the He Ic line center (panels b), and the LOS velocity in the slow He I component (panels c). The color bars associated with panels (c) are saturated for better contrast. The arrows indicate solar north and east. The yellow contours mark the boundaries of sunspots and pores, and the cyan contours mark the umbra-penumbra boundary at the photosphere. The same contours are shown in black in the LOS velocity maps of the slow component. The green and red shaded symbols overplotted on the intensity maps denote the locations of the supersonic downflows. The green symbols highlight supersonic downflows with LOS velocities of up to 20 km s−1, while red symbols represent downflows faster than 20 km s−1, as indicated by the color bars at the top. The black crosses in panels (b) indicate the locations of the corresponding profiles shown in Fig. 1.
Current usage metrics show cumulative count of Article Views (full-text article views including HTML views, PDF and ePub downloads, according to the available data) and Abstracts Views on Vision4Press platform.
Data correspond to usage on the plateform after 2015. The current usage metrics is available 48-96 hours after online publication and is updated daily on week days.
Initial download of the metrics may take a while.