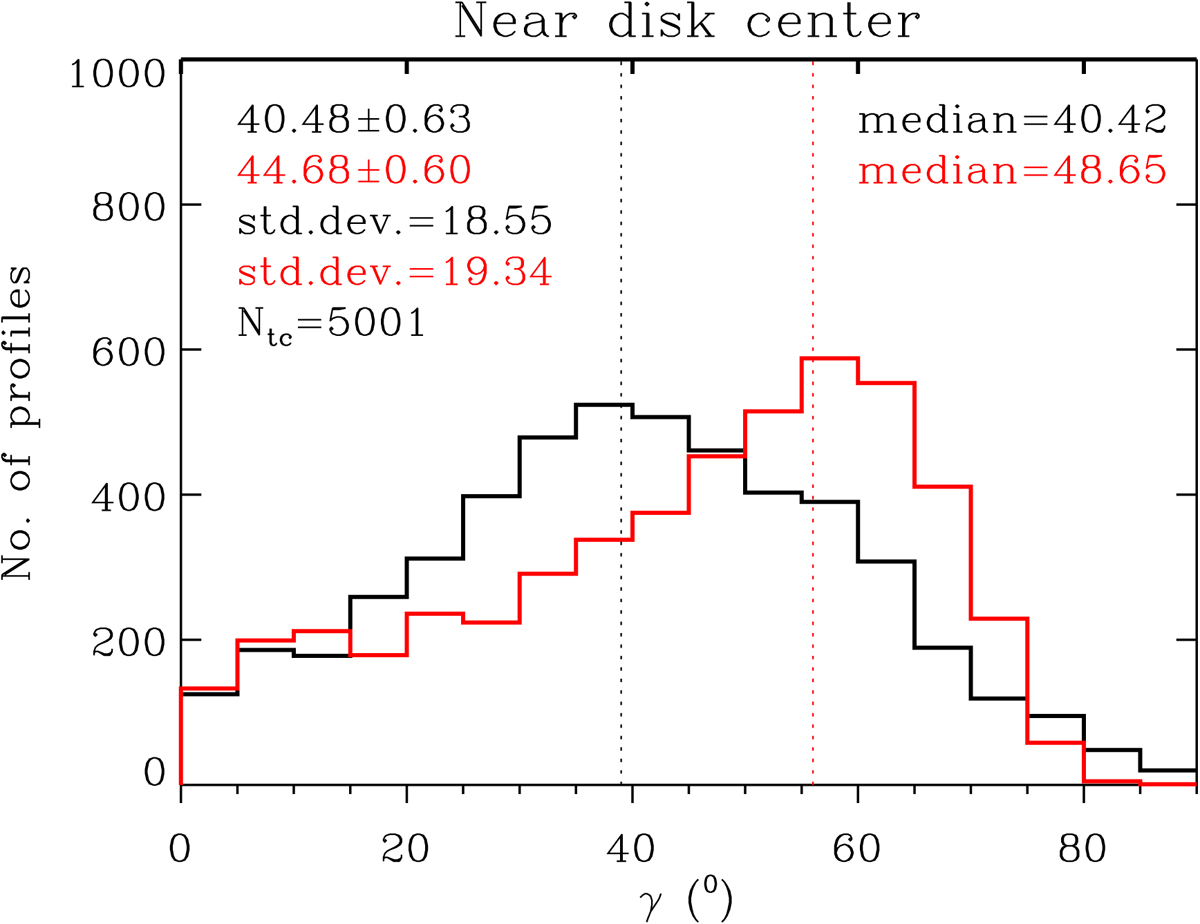
Fig. 10.
Download original image
Distributions of the inclination of the magnetic field for slow (black) and fast (red) components for all data sets observed closer to the disk center (μ > 0.9). “Ntc” is the number of profiles in each category where the supersonic downflow exists with a slow component. The numbers indicate the mean, the uncertainty in the mean, standard deviations, and the median values of distributions for slow (black) and fast (red) components. The vertical dotted lines mark the mode values of the distributions.
Current usage metrics show cumulative count of Article Views (full-text article views including HTML views, PDF and ePub downloads, according to the available data) and Abstracts Views on Vision4Press platform.
Data correspond to usage on the plateform after 2015. The current usage metrics is available 48-96 hours after online publication and is updated daily on week days.
Initial download of the metrics may take a while.