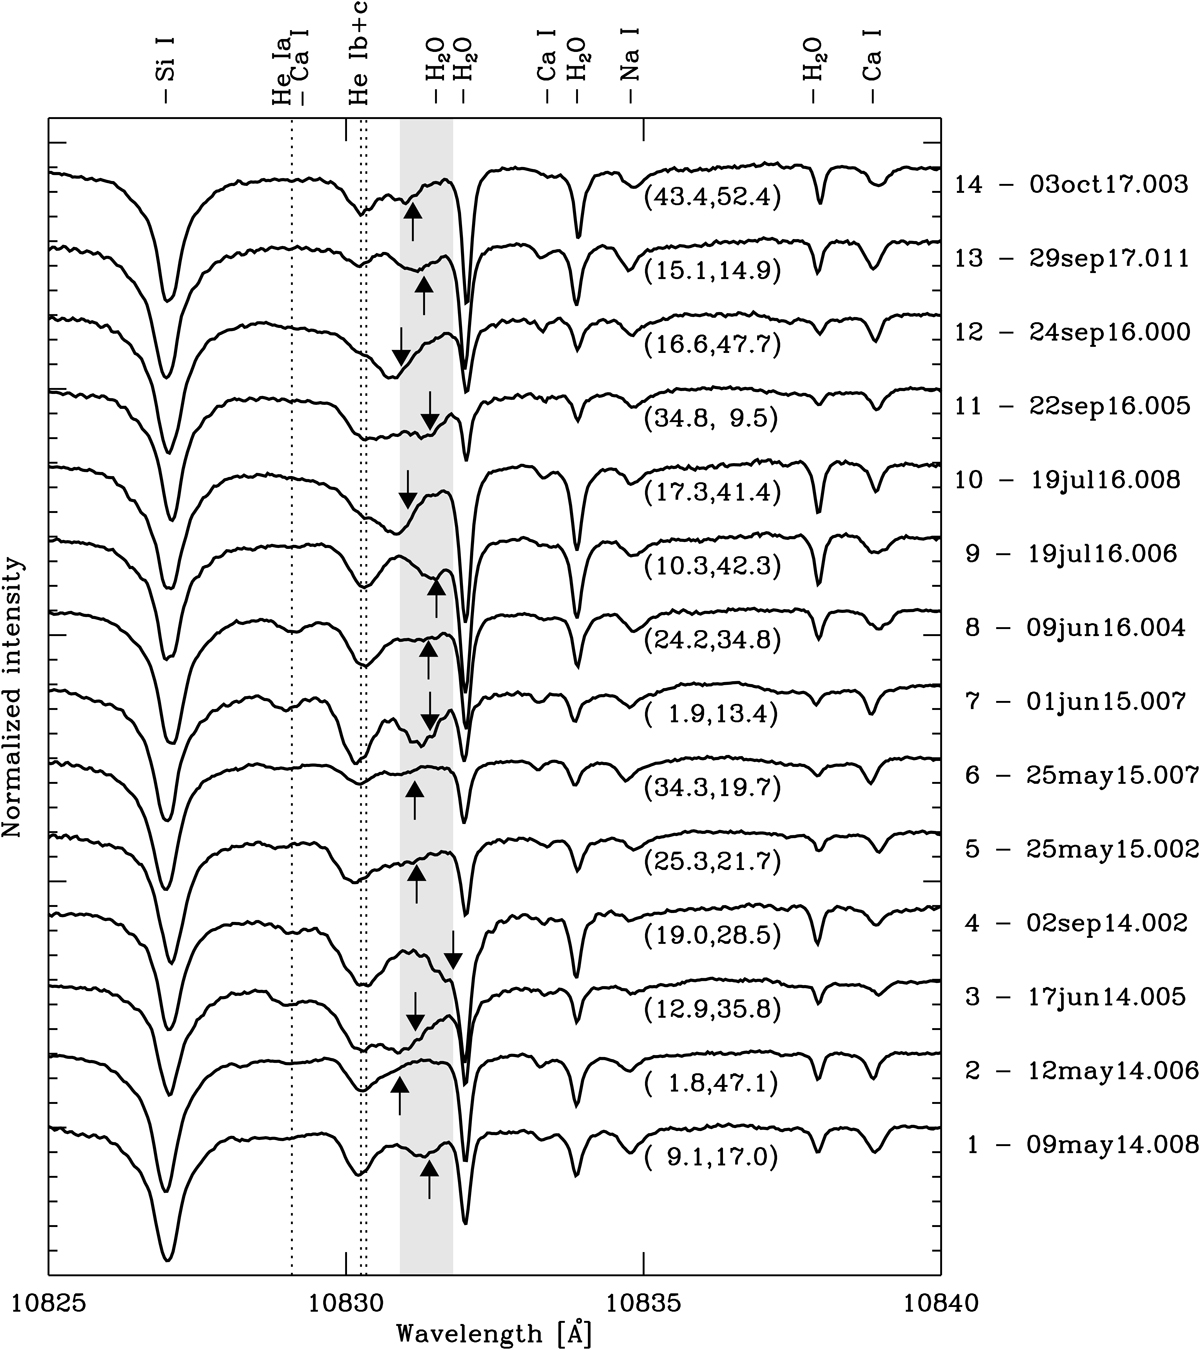
Fig. 1.
Download original image
Examples of Stokes I/Ic profiles, one from each of the 14 data sets, indicating the presence of a strongly redshifted component of the He I 10 830 Å triplet, marked by the arrows. The arrows shown here span the wavelength range corresponding to a velocity shift between 15.6 and 40.4 km s−1 from the He Ic line center. This wavelength range is indicated by the light gray shaded area. The vertical dotted black lines mark the rest wavelengths of the three transitions of the He I 10 830 Å triplet (see Table 2). The numbers in parentheses are the (x, y) coordinates in arcseconds of the location of these profiles on the corresponding intensity images given in Appendix A. The locations of the profiles shown here are also indicated with black crosses on the corresponding He intensity images (panels b) in Figs. A.1–A.4. The other spectral lines in the observed window are identified at the top of the frame. The labels on the right give the number (see Col. I of Table 1) and the ID (see Col. II of Table 1) of the data set to which the profiles belong.
Current usage metrics show cumulative count of Article Views (full-text article views including HTML views, PDF and ePub downloads, according to the available data) and Abstracts Views on Vision4Press platform.
Data correspond to usage on the plateform after 2015. The current usage metrics is available 48-96 hours after online publication and is updated daily on week days.
Initial download of the metrics may take a while.