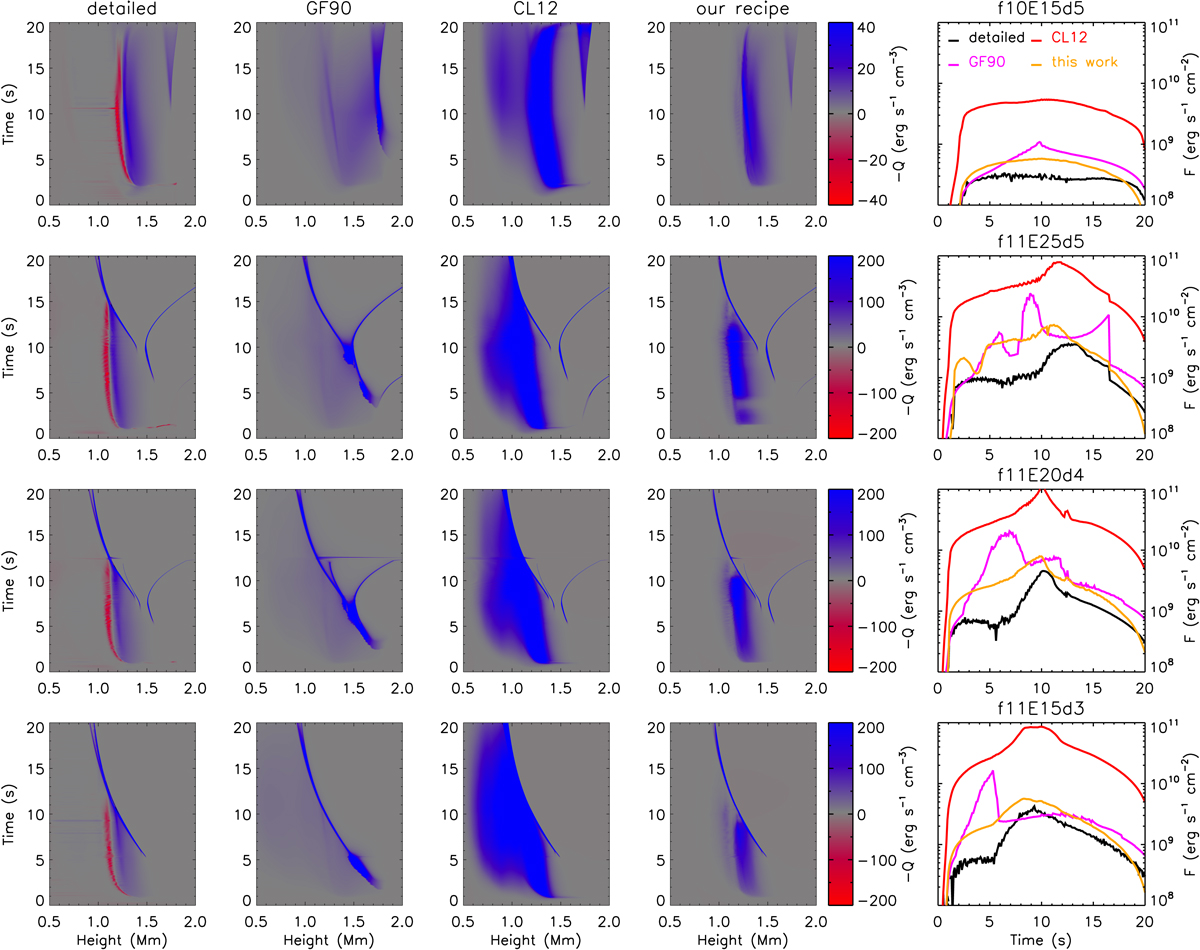
Fig. 4.
Download original image
Comparison of chromospheric radiative losses calculated from detailed solutions and with different approximate recipes for four simulation cases. Blue colors denote radiative cooling, and red colors denote radiative heating. The line plots give comparisons of the evolutions of the radiative cooling rates integrated from 0.5 Mm to 2.0 Mm.
Current usage metrics show cumulative count of Article Views (full-text article views including HTML views, PDF and ePub downloads, according to the available data) and Abstracts Views on Vision4Press platform.
Data correspond to usage on the plateform after 2015. The current usage metrics is available 48-96 hours after online publication and is updated daily on week days.
Initial download of the metrics may take a while.