Fig. 3.
Download original image
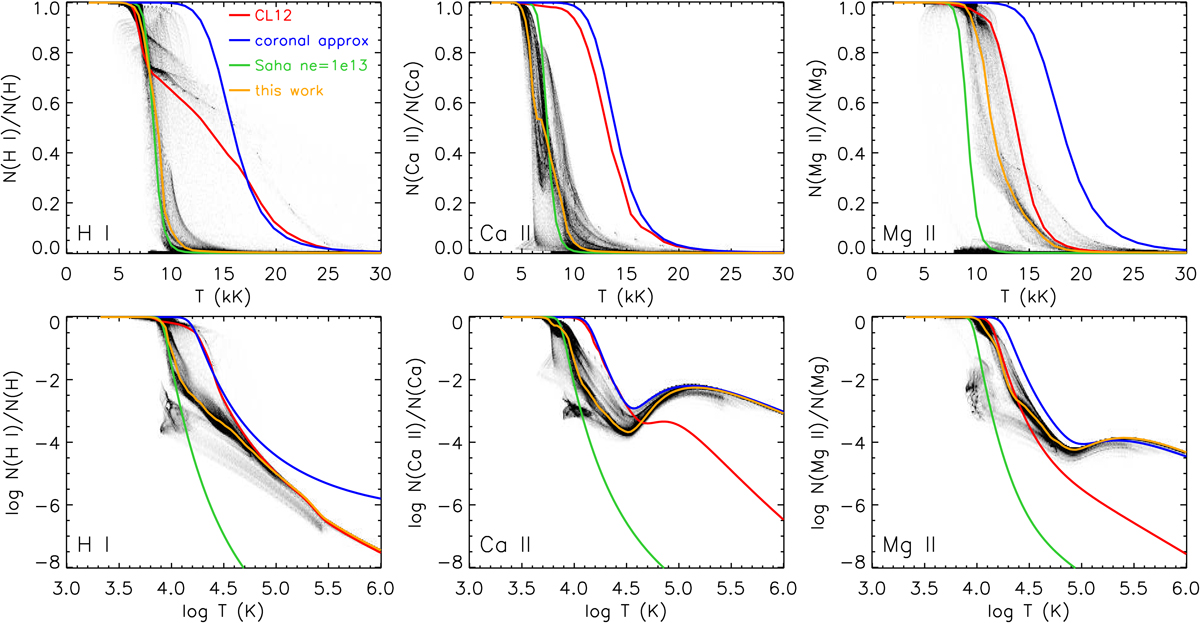
Probability density function of the population fractions (H I, Ca II, and Mg II) as a function of temperature. The panels in the upper row are a zoomed-in view of part of the panels in the lower row for the temperature range of T < 30 kK. Colored lines show the results from the recipe of CL12 (red), the coronal approximation with a two-level atom (blue), the Saha equation with a constant ne = 1013 cm−3 (green), and the adopted fit of the PDF (yellow).
Current usage metrics show cumulative count of Article Views (full-text article views including HTML views, PDF and ePub downloads, according to the available data) and Abstracts Views on Vision4Press platform.
Data correspond to usage on the plateform after 2015. The current usage metrics is available 48-96 hours after online publication and is updated daily on week days.
Initial download of the metrics may take a while.