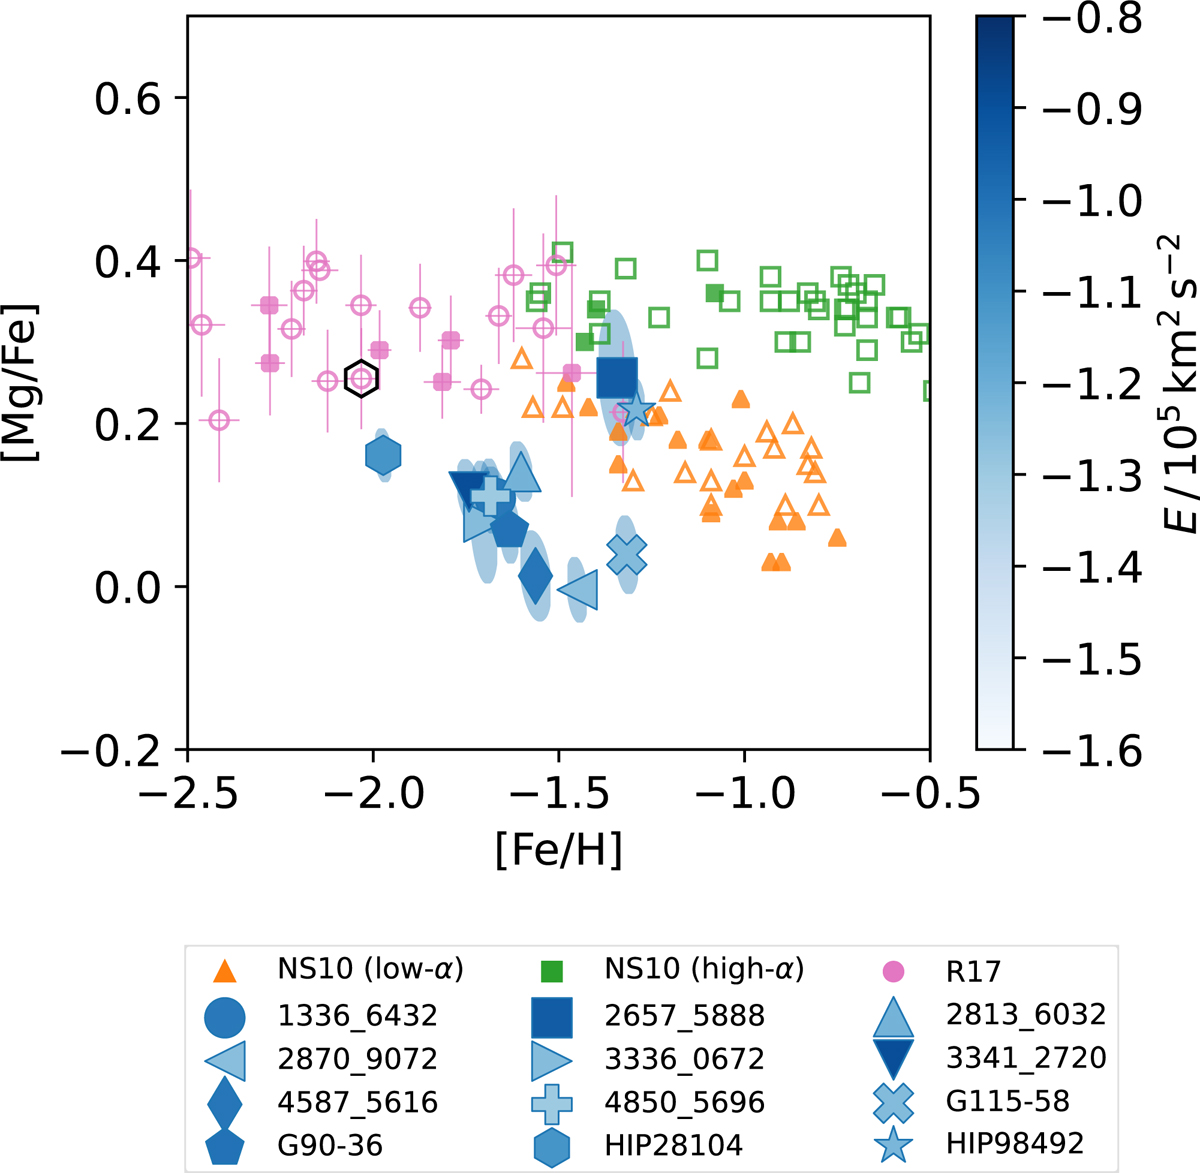
Fig. 5.
Download original image
Mg abundance of the stars. Kinematically selected Sequoia stars are plotted with blue symbols and color-coded according to their orbital energy (see Fig. 1). The measurement uncertainty and the covariance between [Mg/Fe] and [Fe/H] are indicated by the error ellipses. The data point circled with a black hexagon from R 17 indicates the abundance of HIP 28104. The abundance of the comparison samples comes from Nissen & Schuster (2010, 2011), and Reggiani et al. (2017). Filled symbols are for kinematically-selected Gaia-Enceladus stars among the comparison.
Current usage metrics show cumulative count of Article Views (full-text article views including HTML views, PDF and ePub downloads, according to the available data) and Abstracts Views on Vision4Press platform.
Data correspond to usage on the plateform after 2015. The current usage metrics is available 48-96 hours after online publication and is updated daily on week days.
Initial download of the metrics may take a while.