Fig. 13.
Download original image
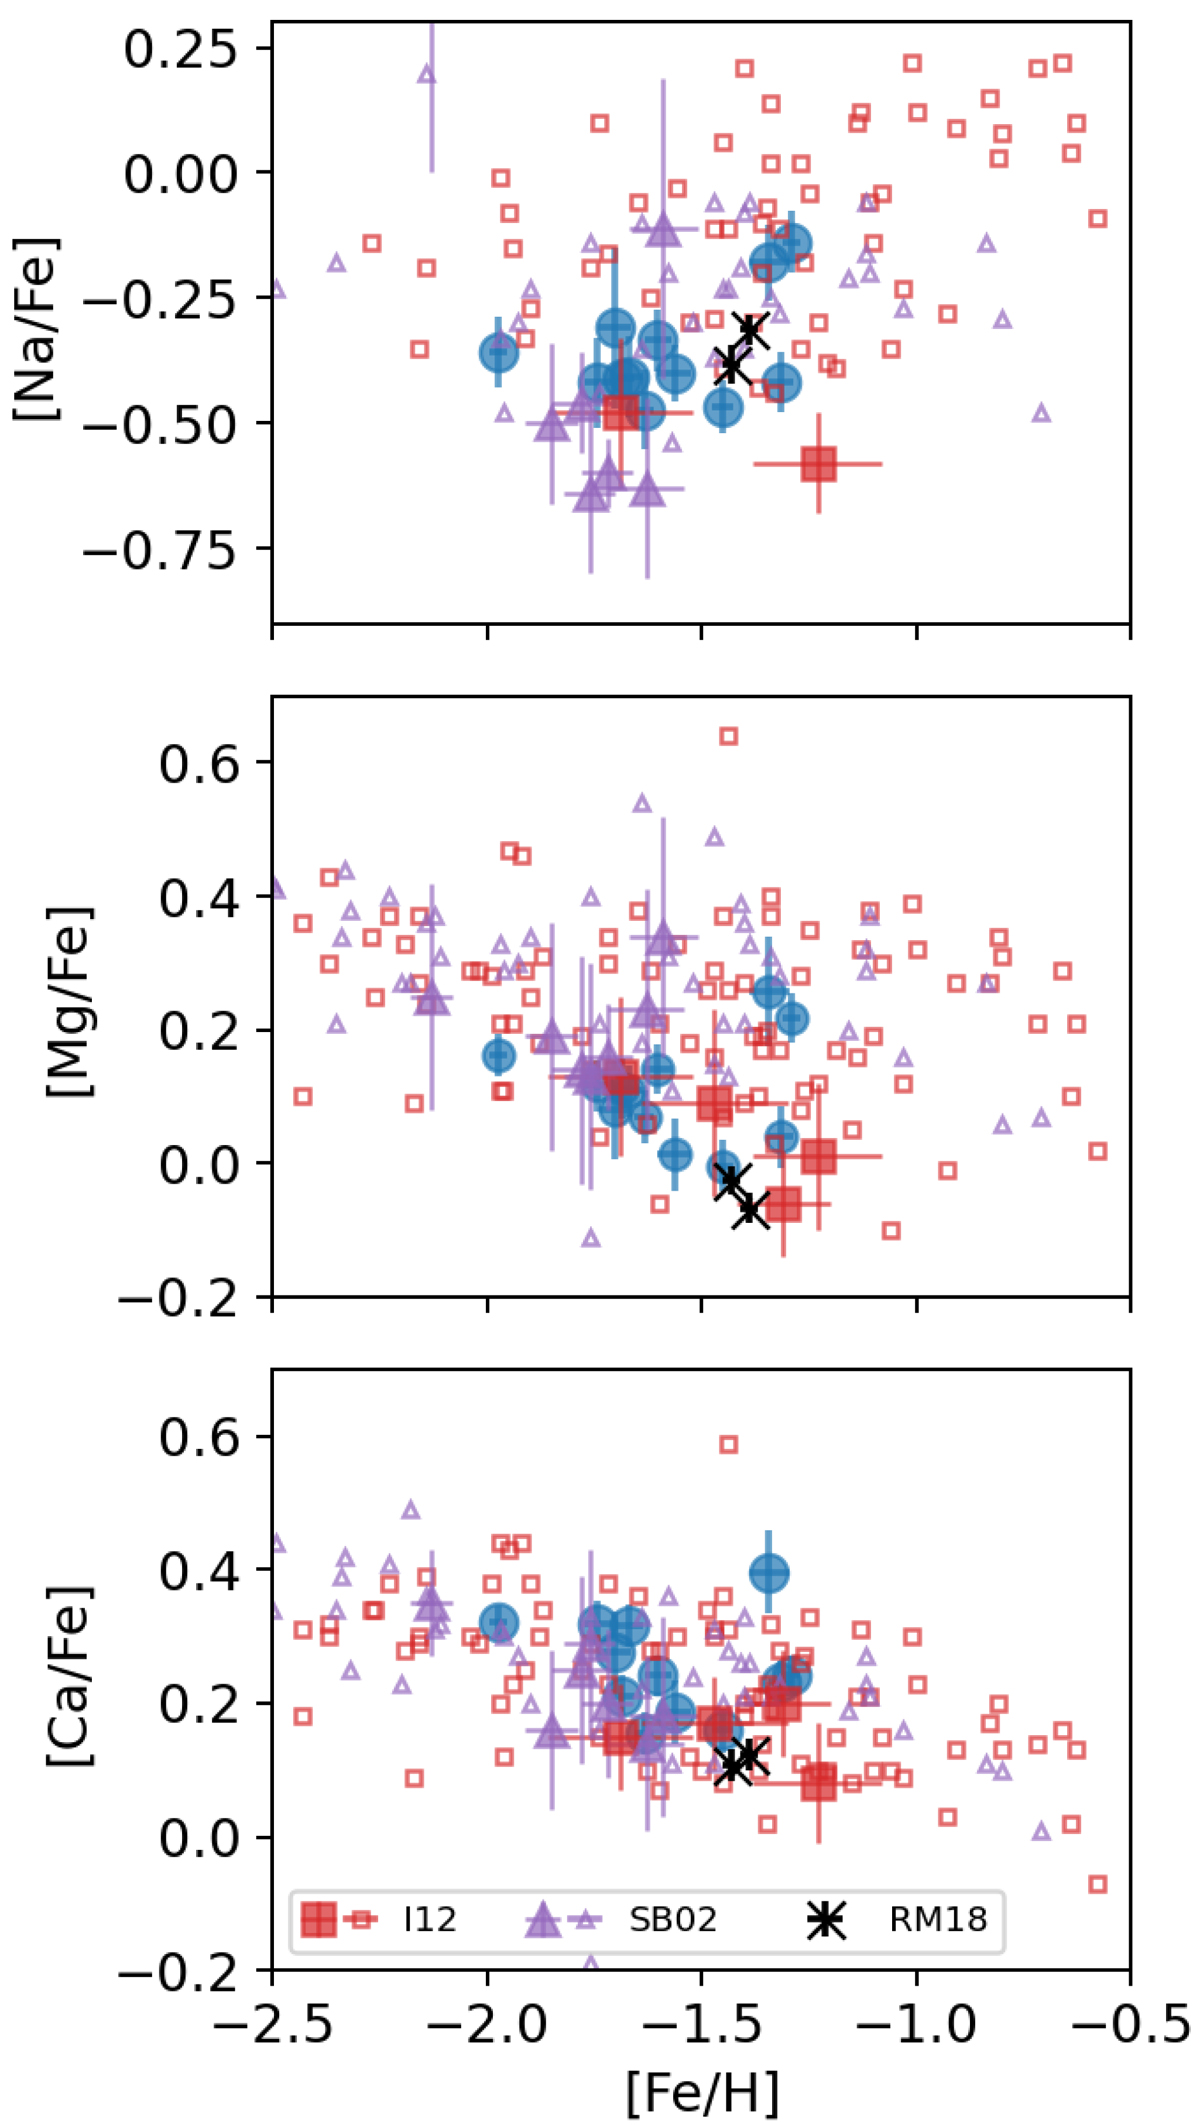
Abundance of stars from the literature and from this study. The literature data come from Stephens & Boesgaard (2002, SB02), Ishigaki et al. (2012, I12), and Reggiani & Meléndez (2018, RM18). Sequoia stars are shown with filled symbols. Stars in the present study are shown with blue circles. We note that the uncertainty is shown with error bars instead of error ellipses for visualization.
Current usage metrics show cumulative count of Article Views (full-text article views including HTML views, PDF and ePub downloads, according to the available data) and Abstracts Views on Vision4Press platform.
Data correspond to usage on the plateform after 2015. The current usage metrics is available 48-96 hours after online publication and is updated daily on week days.
Initial download of the metrics may take a while.