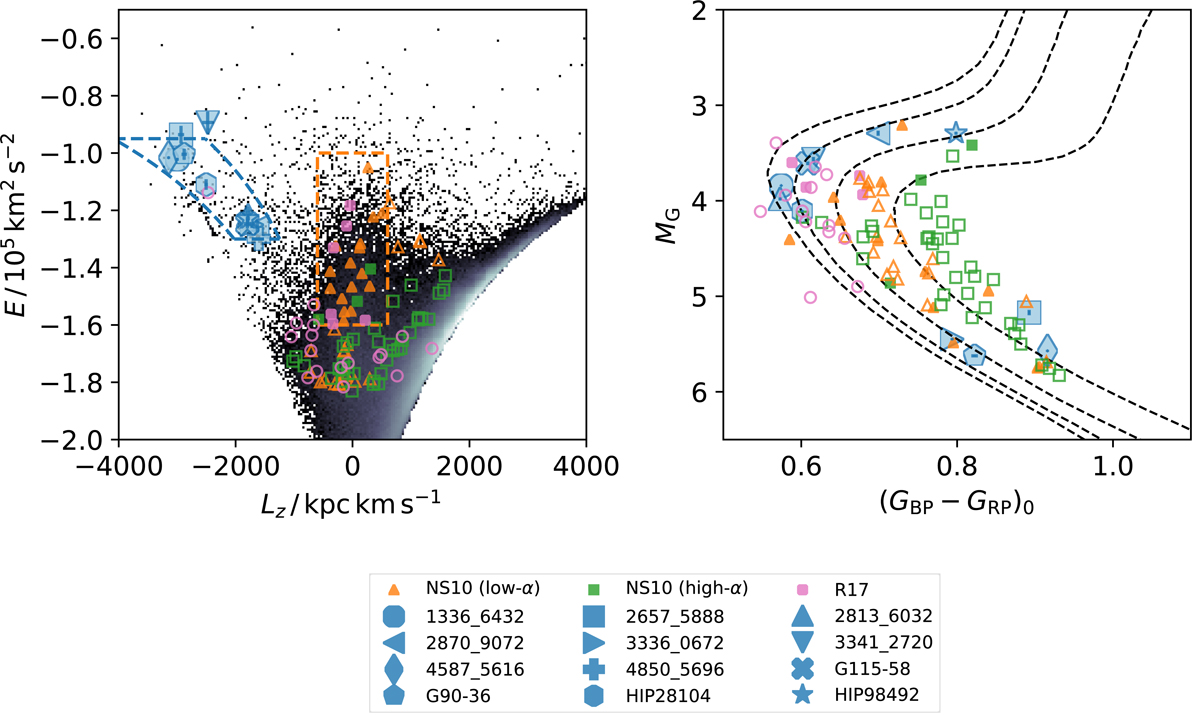
Fig. 1.
Download original image
Kinematic and photometric properties of the stars. Left panel: angular momentum and orbital energy of the observed stars and the comparison stars. We also show the distribution of all stars in Gaia EDR3 with good astrometry (a relative parallax uncertainty smaller than 20%) and Gaia DR2 radial velocity. The blue dotted lines represent the Sequoia selection from Koppelman et al. (2019). Stars in the orange box are used to define the chemical abundance trends of Gaia-Enceladus. NS 10 and R 17 stars within this box are shown with filled symbols, while those outside of it are shown with open symbols. Right panel: Gaia EDR3 color-magnitude diagram of the program stars. We also plotted four PARSEC isochrones with the age of 12 Gyr and [Fe/H] = −2.0, −1.5, −1.0, and −0.5 (from left right). We note that only stars with available extinction estimates from Green et al. (2019) are plotted for the NS 10 and R 17 samples.
Current usage metrics show cumulative count of Article Views (full-text article views including HTML views, PDF and ePub downloads, according to the available data) and Abstracts Views on Vision4Press platform.
Data correspond to usage on the plateform after 2015. The current usage metrics is available 48-96 hours after online publication and is updated daily on week days.
Initial download of the metrics may take a while.