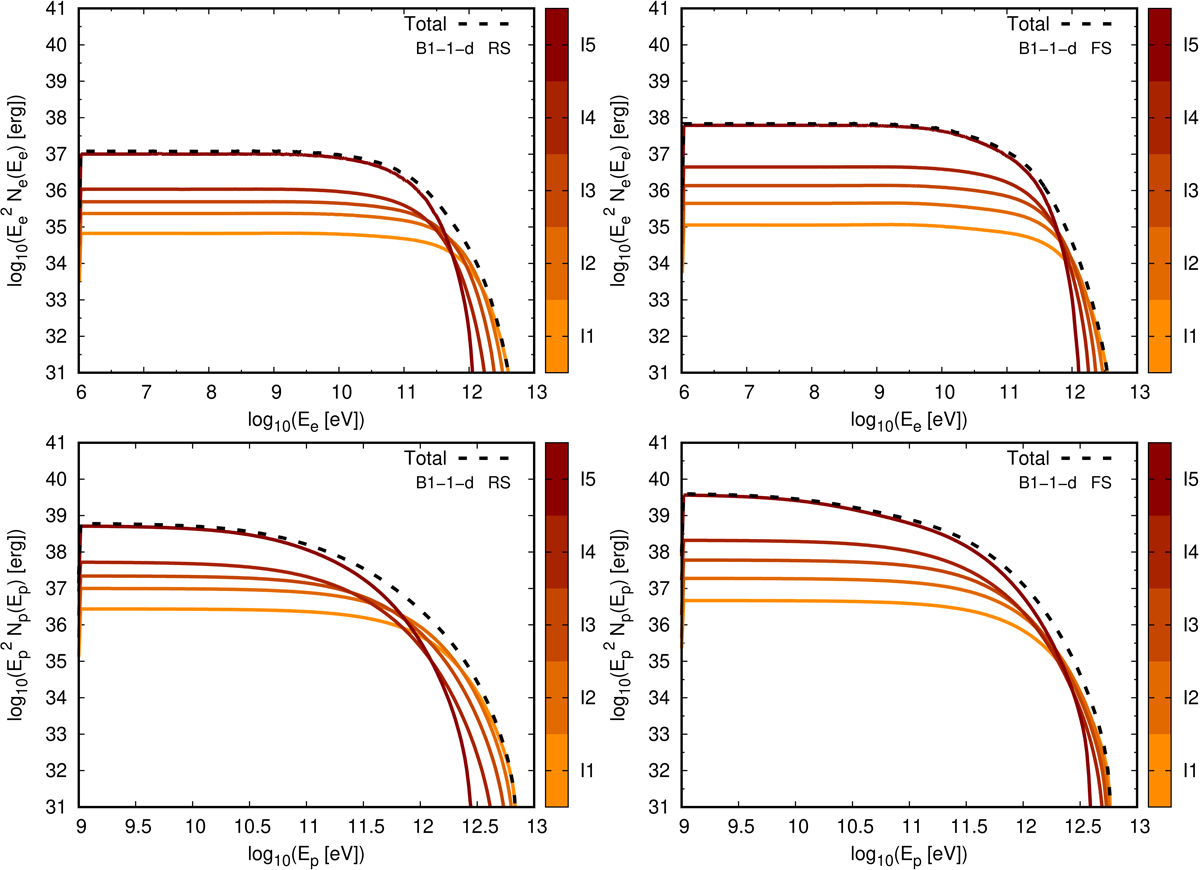
Fig. 6.
Download original image
Particle energy distribution for electrons (top panels) and protons (bottom panels). The left panels are for the RS and the right panels are for the FS. The colour scale represents five different regions of the emitter that correspond to intervals of length Δθ = θmax/5 = 34°. The black dashed line corresponds to the total particle energy distribution.
Current usage metrics show cumulative count of Article Views (full-text article views including HTML views, PDF and ePub downloads, according to the available data) and Abstracts Views on Vision4Press platform.
Data correspond to usage on the plateform after 2015. The current usage metrics is available 48-96 hours after online publication and is updated daily on week days.
Initial download of the metrics may take a while.