Free Access
Fig. 2.
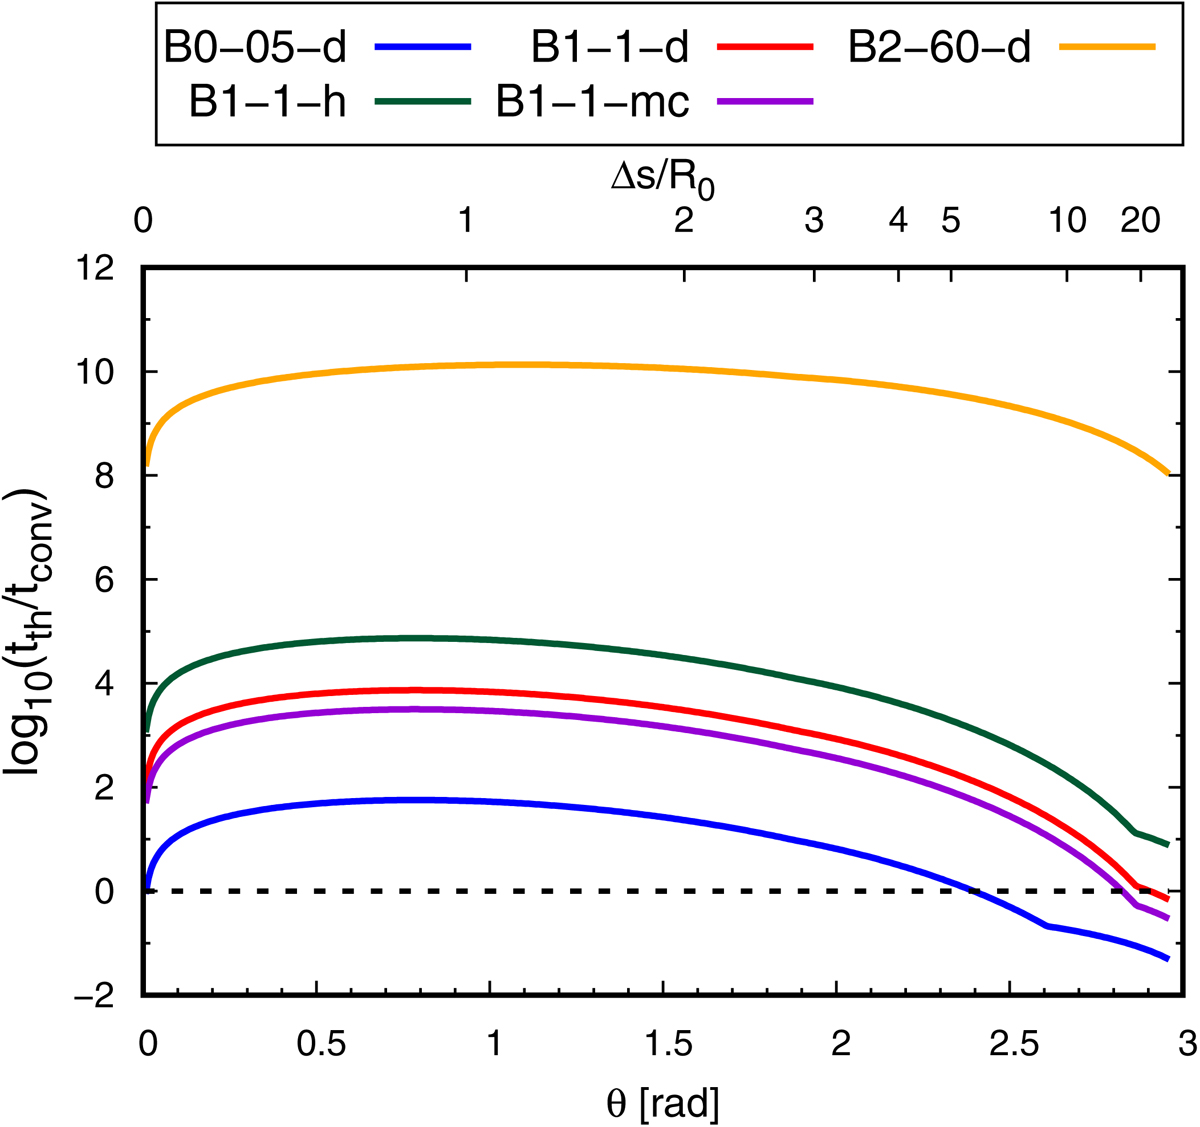
Download original image
Logarithm of the ratio tth/tconv for the different FSs studied in this work. For reference, we plot a black dotted horizontal line at zero (where tth = tconv); curves above this line corresponds to adiabatic shocks.
Current usage metrics show cumulative count of Article Views (full-text article views including HTML views, PDF and ePub downloads, according to the available data) and Abstracts Views on Vision4Press platform.
Data correspond to usage on the plateform after 2015. The current usage metrics is available 48-96 hours after online publication and is updated daily on week days.
Initial download of the metrics may take a while.