Fig. 1.
Download original image
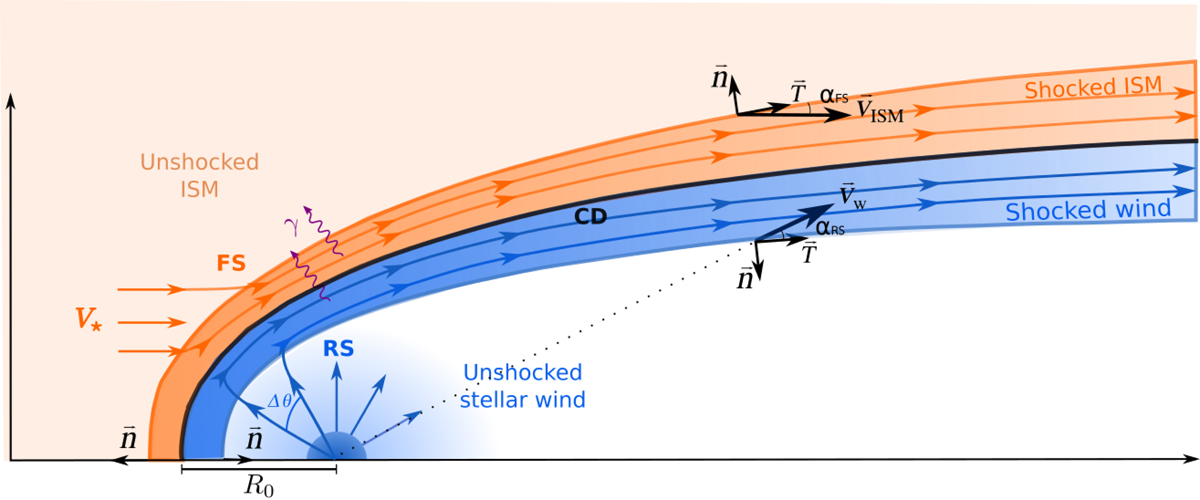
Sketch of the model considered. The position of the CD is represented by a black solid line, while the orange and blue regions represent the FS and the RS, respectively. The solid lines with arrows represent different streamlines in each shock, injected in different positions separated by an angle Δθ. We also show the orientation of perpendicular and tangential vectors to the shocks in different positions, alongside vw and VISM = −V⋆, and the angle α between them. Adapted from del Palacio et al. (2018).
Current usage metrics show cumulative count of Article Views (full-text article views including HTML views, PDF and ePub downloads, according to the available data) and Abstracts Views on Vision4Press platform.
Data correspond to usage on the plateform after 2015. The current usage metrics is available 48-96 hours after online publication and is updated daily on week days.
Initial download of the metrics may take a while.