Free Access
Fig. 8.
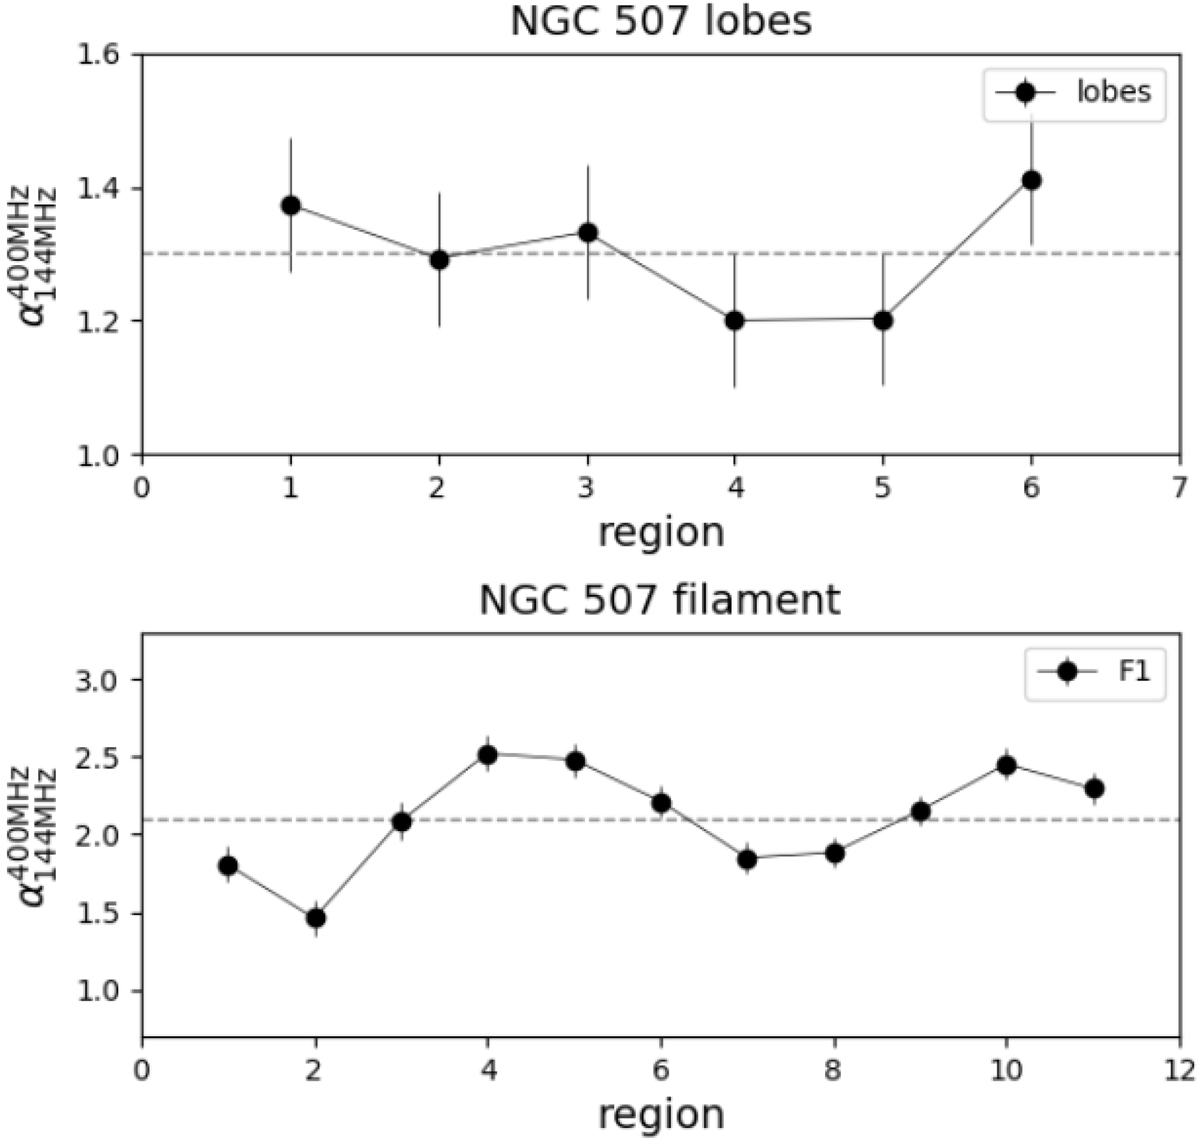
Download original image
Radio spectral index profile across the lobes of NGC 507 (top panel) and its main filament F1 (bottom panel) in the frequency range 144–400 MHz. The grey dashed lines represent the mean values equal to 1.3 and 2.1, respectively. The regions used to extract the profiles are shown in the left panel of Fig. 6.
Current usage metrics show cumulative count of Article Views (full-text article views including HTML views, PDF and ePub downloads, according to the available data) and Abstracts Views on Vision4Press platform.
Data correspond to usage on the plateform after 2015. The current usage metrics is available 48-96 hours after online publication and is updated daily on week days.
Initial download of the metrics may take a while.