Fig. 10.
Download original image
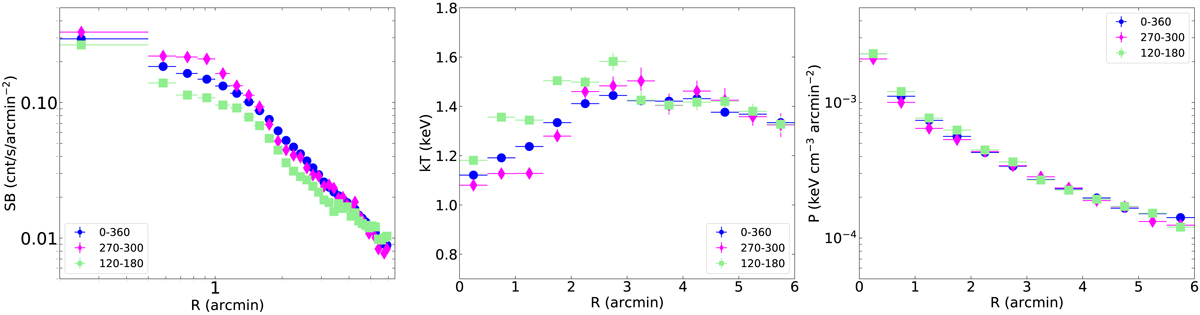
Left: radial surface-brightness profile of the X-ray emission in the 0.7–2.0 keV band extracted from three different sectors. Blue points represent the average azimuthal profile (0–360 deg), green points represent the eastern sector (120–180 deg), and magenta points represent the southern sector (270–300 deg) as shown in Fig. 9. Middle: temperature profiles in the same sectors as in the left panel. Right: pressure profiles in the same sectors as in the left panel.
Current usage metrics show cumulative count of Article Views (full-text article views including HTML views, PDF and ePub downloads, according to the available data) and Abstracts Views on Vision4Press platform.
Data correspond to usage on the plateform after 2015. The current usage metrics is available 48-96 hours after online publication and is updated daily on week days.
Initial download of the metrics may take a while.