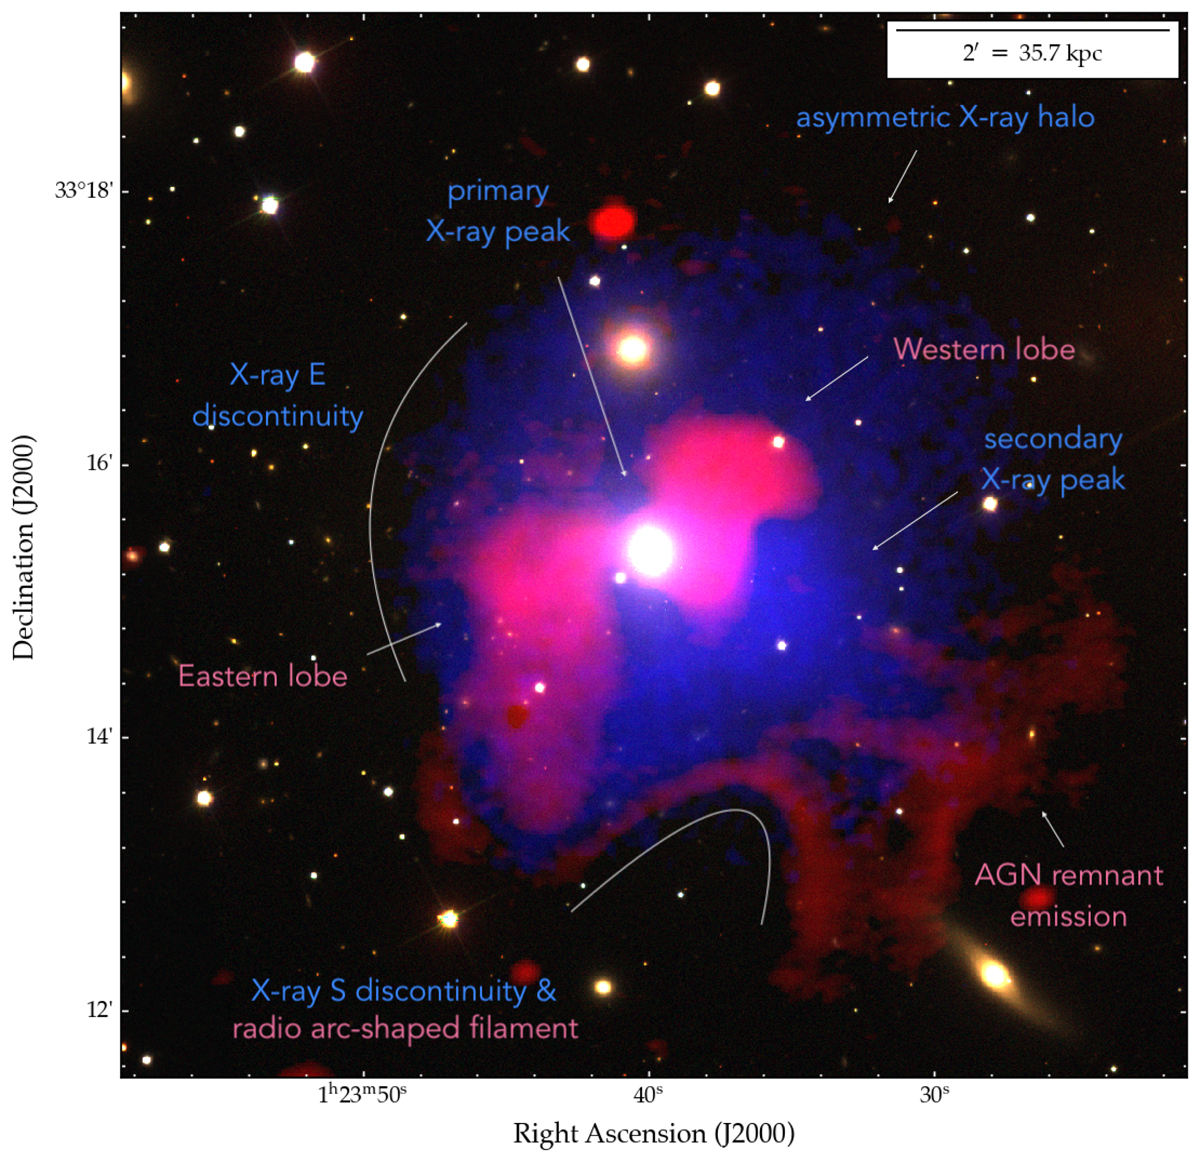
Fig. 1.

Download original image
Composite image of the galaxy group NGC 507. Optical emission is shown in background (r-band, g-band, and i-band images from the Sloan Digital Sky Survey, SDSS), radio emission is shown in red (LOFAR image presented in this work at 144 MHz with 5.57 arcsec × 8.09 arcsec resolution), and X-ray emission is shown in blue (XMM-Newton image at 0.7–2 keV). The most significant features of the system are labelled and a reference scale is shown in the top-right corner.
Current usage metrics show cumulative count of Article Views (full-text article views including HTML views, PDF and ePub downloads, according to the available data) and Abstracts Views on Vision4Press platform.
Data correspond to usage on the plateform after 2015. The current usage metrics is available 48-96 hours after online publication and is updated daily on week days.
Initial download of the metrics may take a while.


