Fig. 6
Download original image
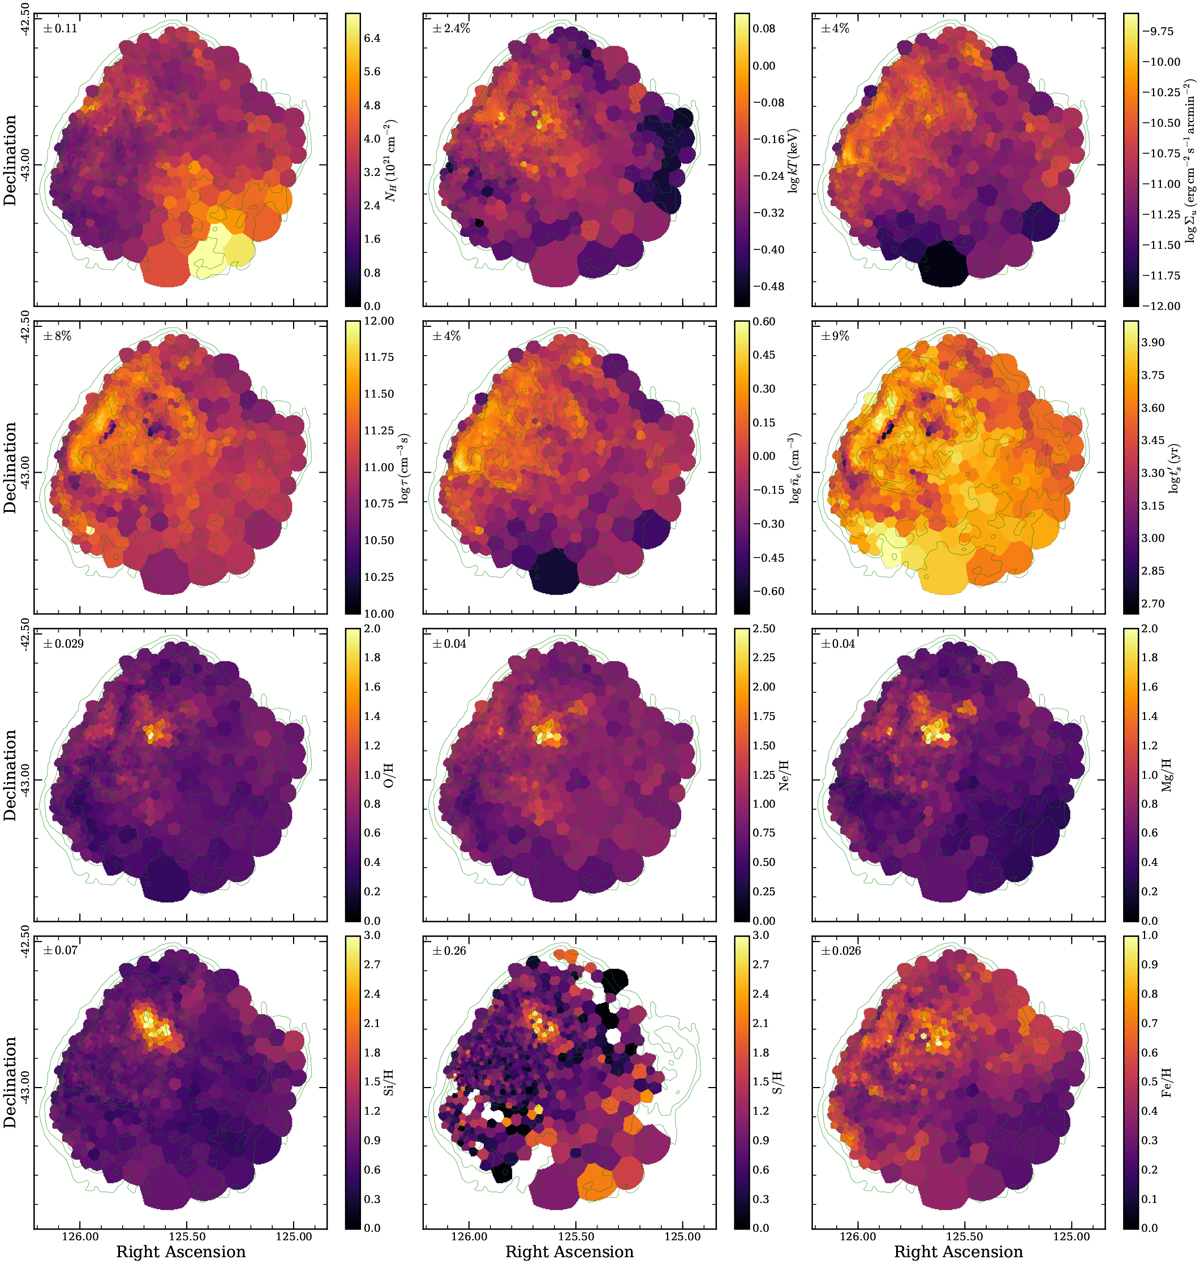
Parameter maps obtained from spectral fits to adaptively binned regions with S/N = 200. The color bar on the right of each panel indicates the displayed range of the respective parameter. The quantities displayed in the individual panels are the absorption column density NH, the plasma temperature kT, the unabsorbed surface brightness Σu in the 0.2–5.0 keV band, the ionization age τ, the electron density proxy ![]() , the pseudo-shock-age
, the pseudo-shock-age ![]() as well as the abundances of oxygen, neon, magnesium, silicon, sulfur, and iron normalized to solar values. All bins that extend up until the edge of our input image were masked, as these are dominated by background. An additional masking was applied to the map of sulfur abundances, as described in the text. In the upper left corner of each panel, we indicate the typical statistical uncertainty of the displayed quantity, which corresponds to the median over all bins of the distribution of the 1σ- error. For all logarithmically displayed quantities, the characteristic fractional error is reported in per cent. For those displayed on a linear scale, the error is given in the same units as indicated on the color bar. The green contours in each panel trace the broad-band count rate of Puppis A, shown in Fig. 1.
as well as the abundances of oxygen, neon, magnesium, silicon, sulfur, and iron normalized to solar values. All bins that extend up until the edge of our input image were masked, as these are dominated by background. An additional masking was applied to the map of sulfur abundances, as described in the text. In the upper left corner of each panel, we indicate the typical statistical uncertainty of the displayed quantity, which corresponds to the median over all bins of the distribution of the 1σ- error. For all logarithmically displayed quantities, the characteristic fractional error is reported in per cent. For those displayed on a linear scale, the error is given in the same units as indicated on the color bar. The green contours in each panel trace the broad-band count rate of Puppis A, shown in Fig. 1.
Current usage metrics show cumulative count of Article Views (full-text article views including HTML views, PDF and ePub downloads, according to the available data) and Abstracts Views on Vision4Press platform.
Data correspond to usage on the plateform after 2015. The current usage metrics is available 48-96 hours after online publication and is updated daily on week days.
Initial download of the metrics may take a while.