Fig. 5
Download original image
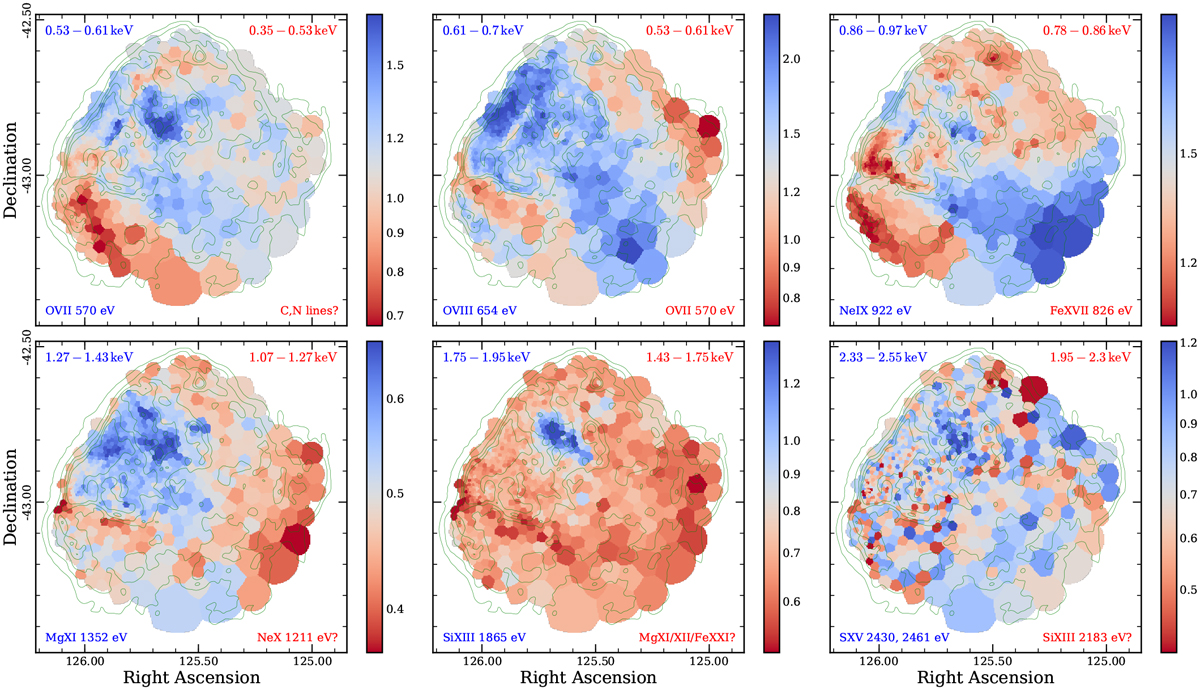
Maps of the ratio H calculated from selected adjacent narrow energy bands. In each panel, we indicate a larger relative strength of the harder (softer) band in blue (red), with the respective energy ranges indicated in the upper left (right) corner. The median 1σ uncertainties of H, which illustrate the typical statistical noise level in each panel, are (from left to right) 0.029, 0.032, and 0.023 in the top row, and 0.015, 0.040, and 0.13 in the bottom row. The green contours trace the broad-band surface brightness of Puppis A, as displayed in Fig. 1.
Current usage metrics show cumulative count of Article Views (full-text article views including HTML views, PDF and ePub downloads, according to the available data) and Abstracts Views on Vision4Press platform.
Data correspond to usage on the plateform after 2015. The current usage metrics is available 48-96 hours after online publication and is updated daily on week days.
Initial download of the metrics may take a while.