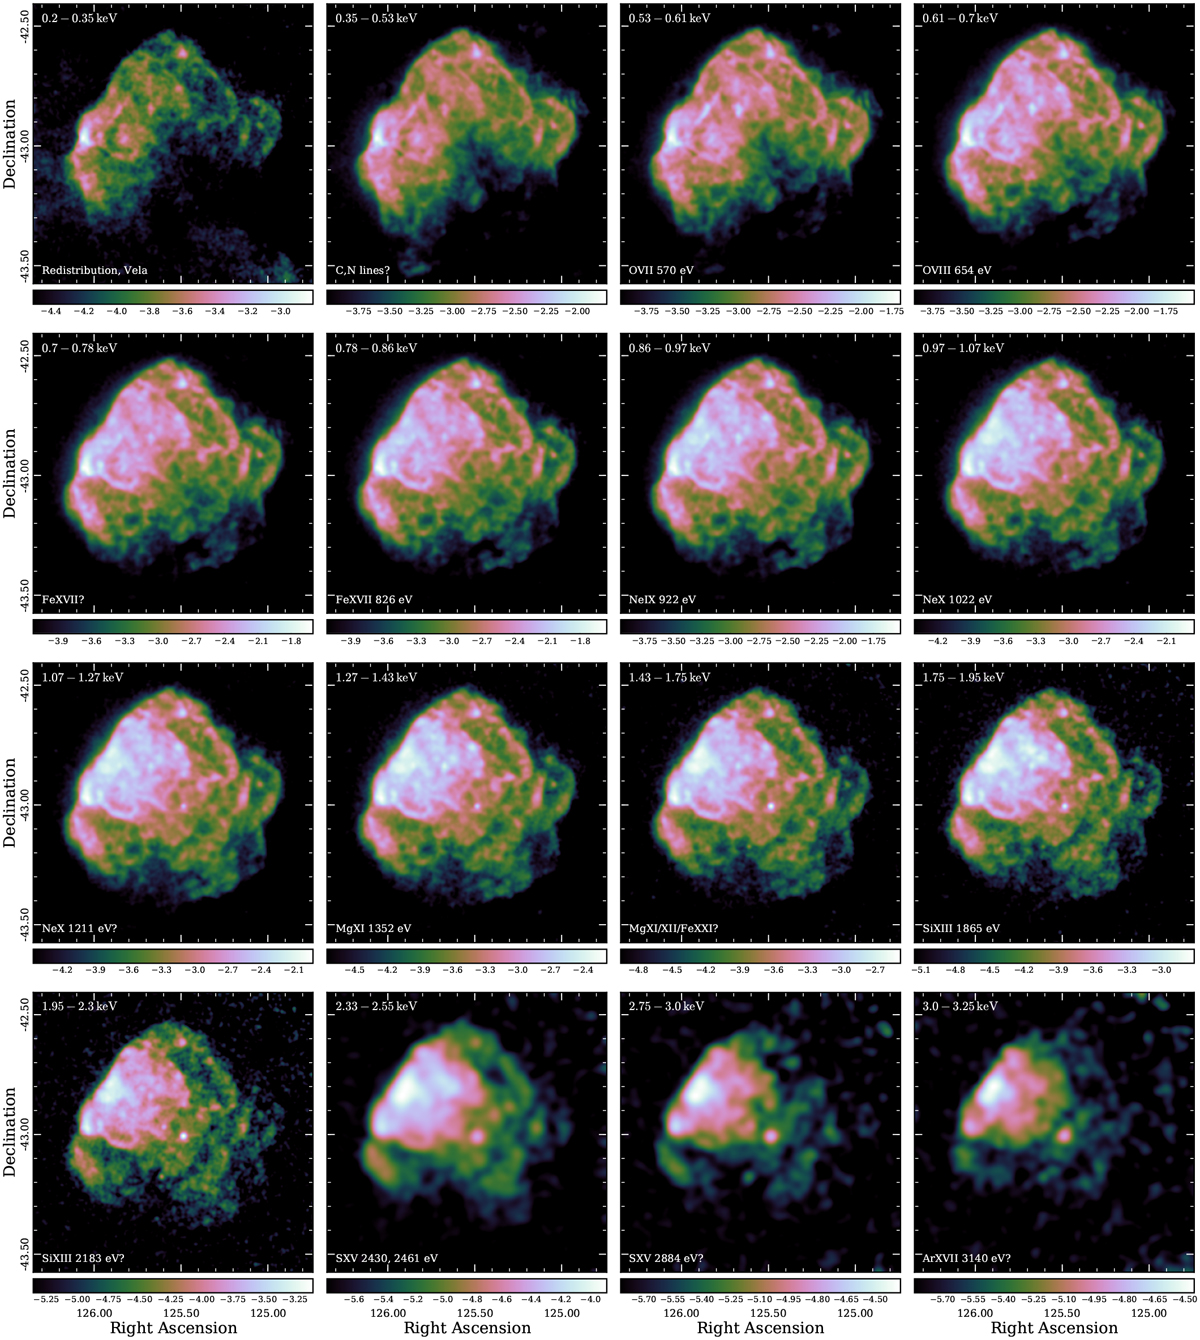
Fig. 4
Download original image
Exposure-corrected narrow-band images of Puppis A. For all bands below 2.3 keV, we used a uniform smoothing kernel of 20 ”, while for those above 2.3 keV, we used 60 ”. These kernels were chosen in order to ensure maximum comparability between bands, while taking into account the much poorer statistics at high energies. In each image, we used a logarithmic color scale with the maximum at the peak count rate, and the minimum at the median count rate of all displayed pixels. The color bar underneath each panel indicates the displayed range of the logarithmic count rate per pixel to illustrate the dynamic range of each image. The upper left corner of each panel indicates the energy band covered by the image, while in the lower left corner, we indicate the physical content of the respective energy range. Components marked with a question mark are expected to be subdominant with respect to the (apparent) continuum.
Current usage metrics show cumulative count of Article Views (full-text article views including HTML views, PDF and ePub downloads, according to the available data) and Abstracts Views on Vision4Press platform.
Data correspond to usage on the plateform after 2015. The current usage metrics is available 48-96 hours after online publication and is updated daily on week days.
Initial download of the metrics may take a while.