Fig. 3
Download original image
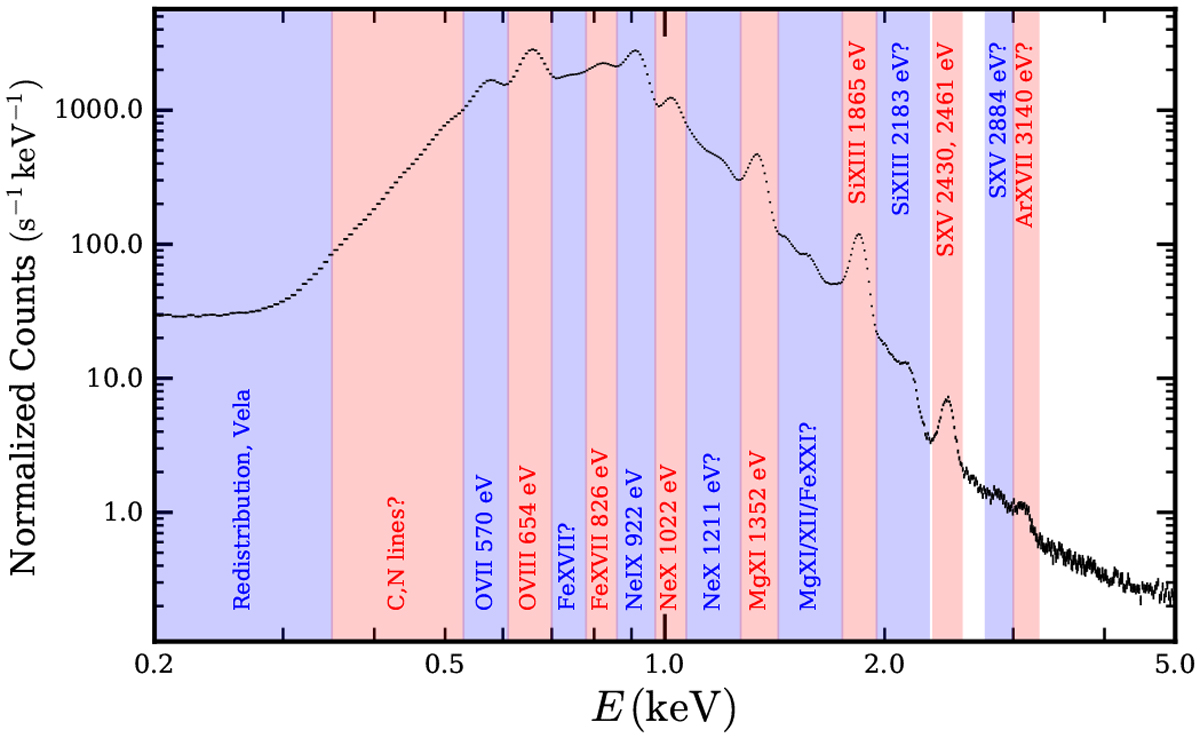
Integrated spectrum of the entire Puppis A SNR in the range 0.2–5.0 keV. The energy bands defined for narrow-band imaging are indicated in blue and red, together with the main contributions to the emission in the band. Line components marked with a question mark are likely present but subdominant with respect to the continuum.
Current usage metrics show cumulative count of Article Views (full-text article views including HTML views, PDF and ePub downloads, according to the available data) and Abstracts Views on Vision4Press platform.
Data correspond to usage on the plateform after 2015. The current usage metrics is available 48-96 hours after online publication and is updated daily on week days.
Initial download of the metrics may take a while.