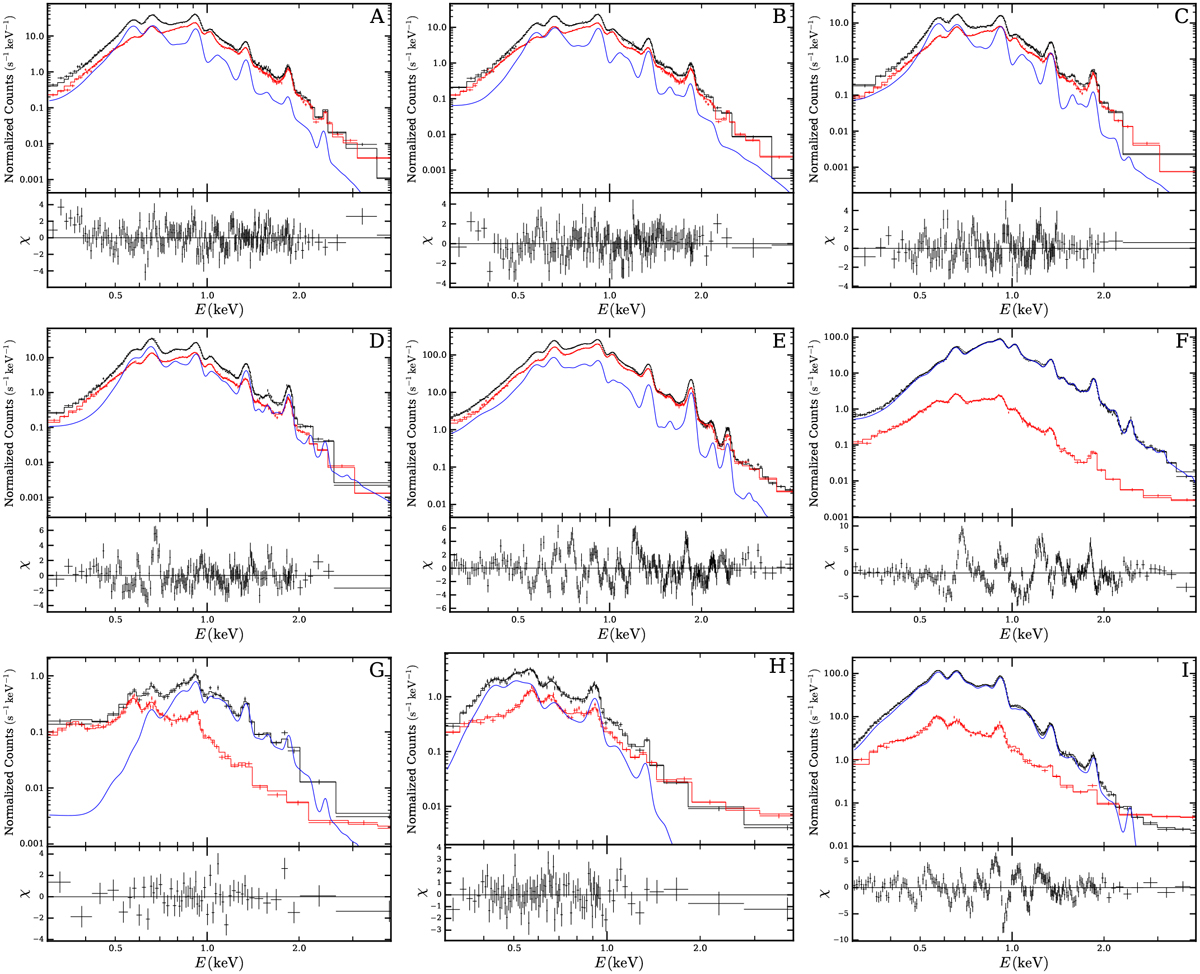
Fig. 10
Download original image
Detailed fits to source and background spectra extracted from the regions indicated in Fig. 9 and labeled accordingly. In each panel, the background spectrum and binned model are displayed in red, while the total spectrum and model for the source region are shown in black. The blue line indicates the “background-subtracted ” best-fit source model. The background spectra and models have been rescaled to represent their contribution to the source region spectrum. The lower part of each panel indicates the residuals of the spectrum in the source region with respect to its best-fit model for source plus background. The fits displayed here correspond to case (i) outlined in the text, meaning metal abundances were left free to vary within a range typical for (enriched) ISM. The spectra and models were rebinned, for plotting purposes only, to a minimum signal-to-noise ratio of 5.
Current usage metrics show cumulative count of Article Views (full-text article views including HTML views, PDF and ePub downloads, according to the available data) and Abstracts Views on Vision4Press platform.
Data correspond to usage on the plateform after 2015. The current usage metrics is available 48-96 hours after online publication and is updated daily on week days.
Initial download of the metrics may take a while.