Fig. 1
Download original image
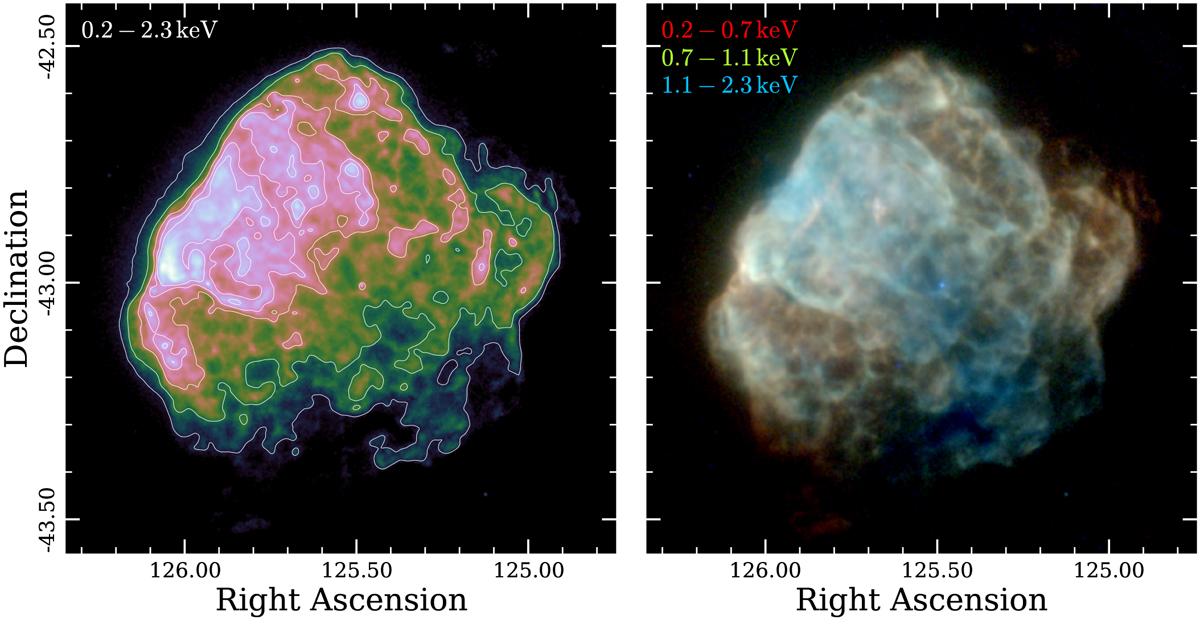
Single-band (left) and false-color (right) exposure-corrected images of Puppis A in the 0.2–2.3 keV range as seen by eROSITA. Both images were smoothed using a Gaussian kernel of width 6”. The color scale in this, as in all images shown in this work, is logarithmic. The contours in the left panel trace the 0.2–2.3 keV emission at levels of 1 × 10−4,3 x 10−4, 1 × 10−3,2 × 10−3,3 × 10⁻³ cts−1 arcsec−2. For comparison, the local background level in the broad band, measured in a region around 30’ northeast of the rim of Puppis A using the same observation, is around 1.2 × 10⁻⁵ ct s−1 arcsec−2.
Current usage metrics show cumulative count of Article Views (full-text article views including HTML views, PDF and ePub downloads, according to the available data) and Abstracts Views on Vision4Press platform.
Data correspond to usage on the plateform after 2015. The current usage metrics is available 48-96 hours after online publication and is updated daily on week days.
Initial download of the metrics may take a while.