Fig. 5.
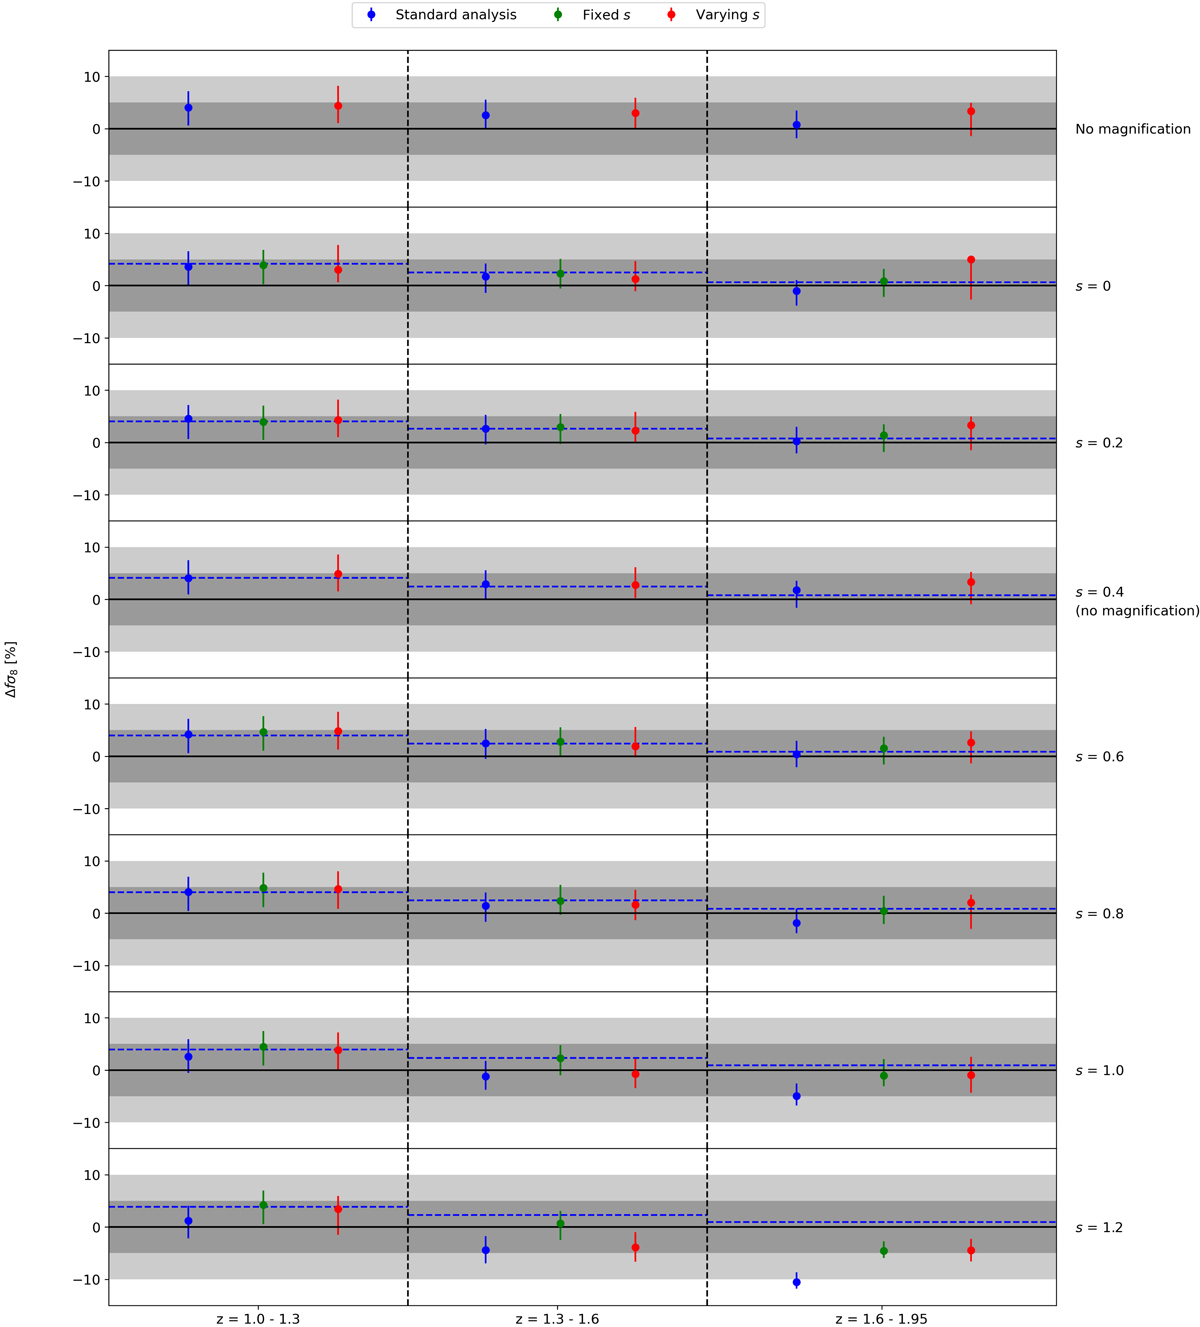
Download original image
Relative difference on fσ8 with respect to its fiducial value as a function of redshift bins and sample configuration for ΛCDM particles. The data points in blue, green, and red refer to different analyses where we only account for RSD, add magnification bias with s fixed and s free, respectively (see also Sect. 3.2.3). The central values are those of the overall best fit, while error bars are those of the 68% confidence interval on the marginalised distribution. The dashed blue lines show the value for the unmagnified case. The grey shades highlight the ±5% and 10% ranges.
Current usage metrics show cumulative count of Article Views (full-text article views including HTML views, PDF and ePub downloads, according to the available data) and Abstracts Views on Vision4Press platform.
Data correspond to usage on the plateform after 2015. The current usage metrics is available 48-96 hours after online publication and is updated daily on week days.
Initial download of the metrics may take a while.