Fig. 8.
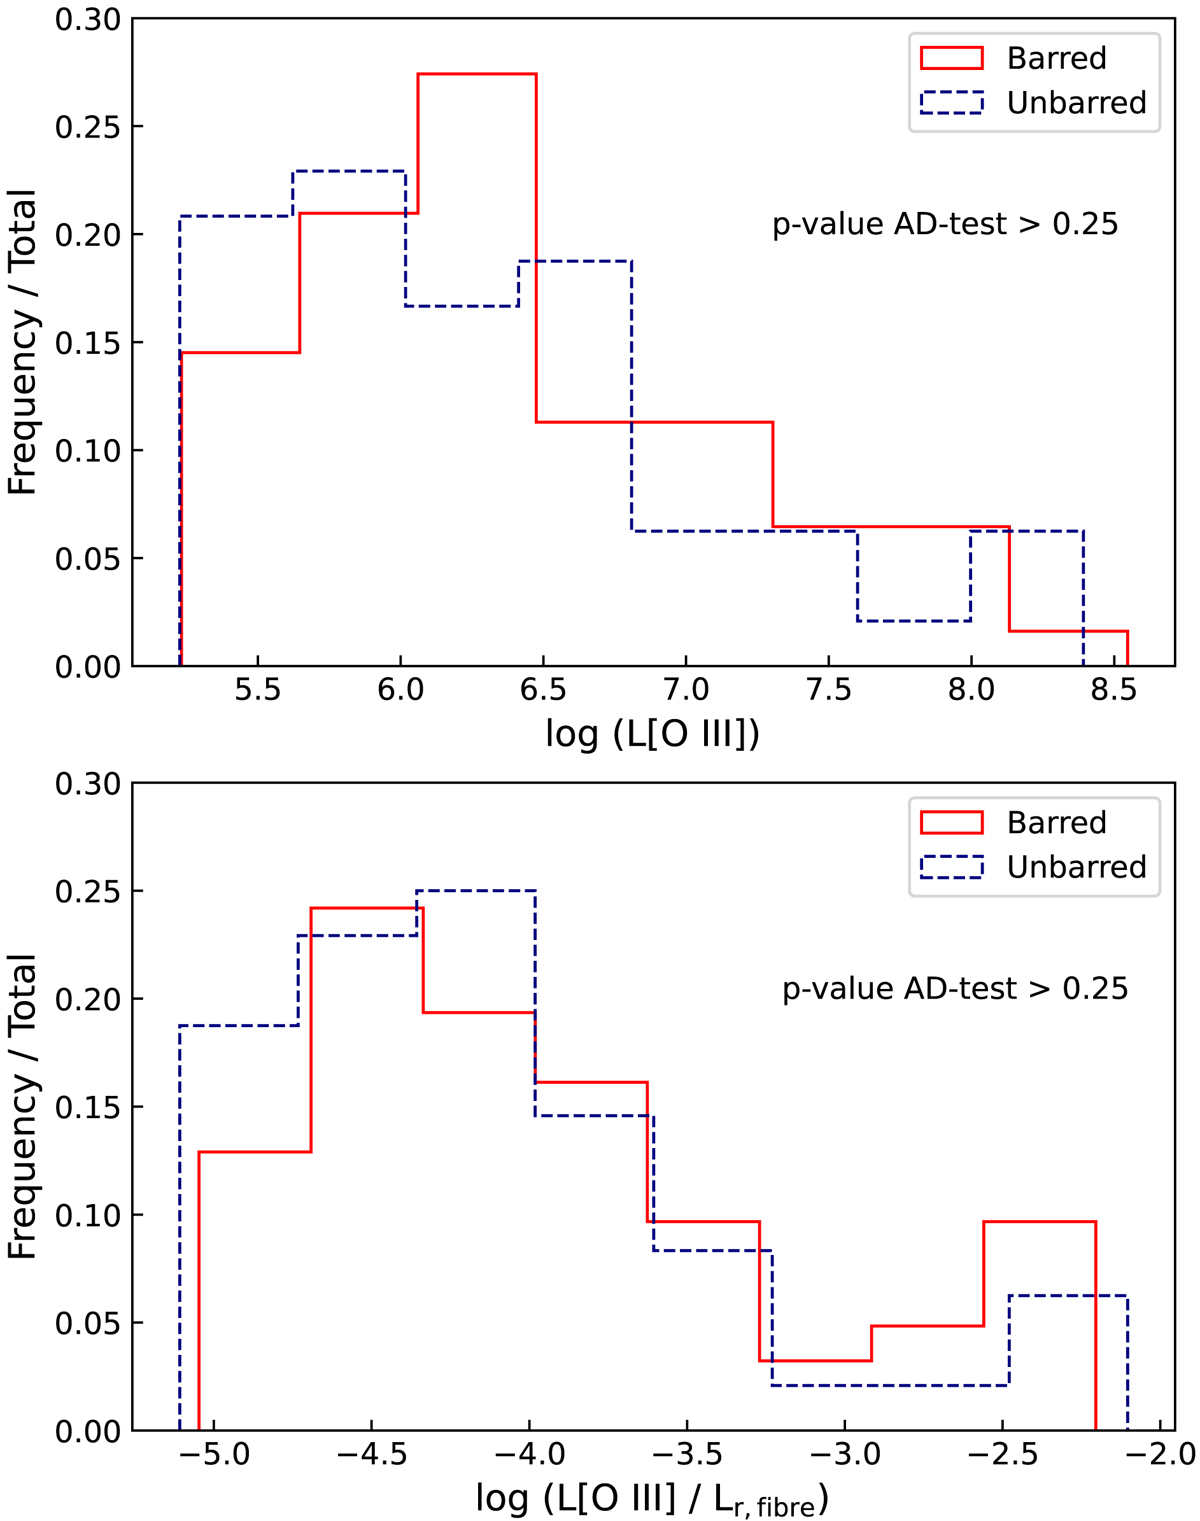
Download original image
Distribution of [O III] luminosity. Top panel: distribution of [O III]λ5007 luminosity for barred and unbarred galaxies. Bottom panel: distribution of L[O III]/Lr,fibre for barred and unbarred galaxies. In both panels, the continuous red line represents the distribution for barred galaxies, while the dashed blue line is the distribution for unbarred galaxies. Neither test allows us to claim the existence of differences in the distributions of these parameters regarding morphology.
Current usage metrics show cumulative count of Article Views (full-text article views including HTML views, PDF and ePub downloads, according to the available data) and Abstracts Views on Vision4Press platform.
Data correspond to usage on the plateform after 2015. The current usage metrics is available 48-96 hours after online publication and is updated daily on week days.
Initial download of the metrics may take a while.