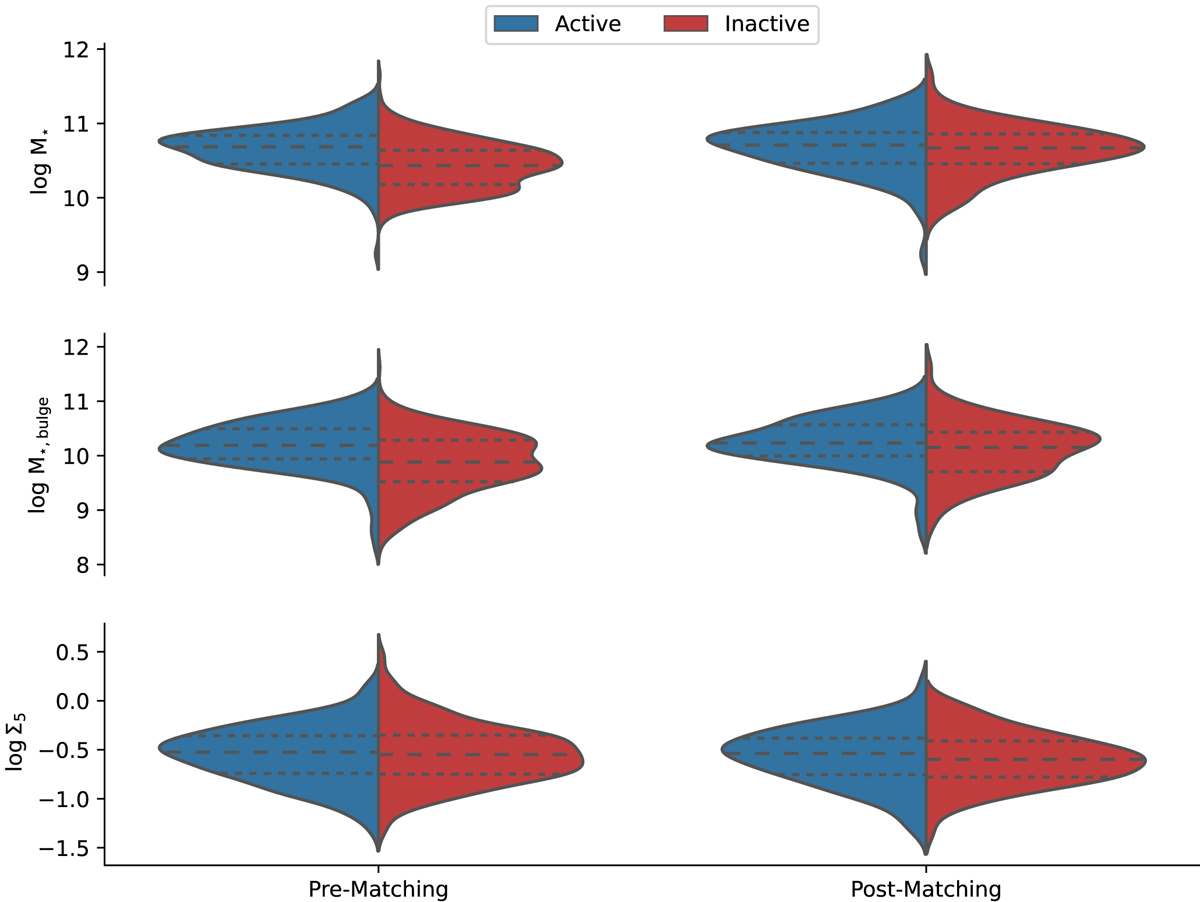
Fig. 3.
Download original image
Matching graphical diagnostic similar to that found in de Souza et al. (2016) for M⋆, M⋆,bulge, and Σ5 (simultaneous matching). The figure shows the distributions of active and inactive objects before and after the matching process. Long-dashed and short-dashed lines show the mean value of the distribution and the quartiles Q1 and Q3, respectively.
Current usage metrics show cumulative count of Article Views (full-text article views including HTML views, PDF and ePub downloads, according to the available data) and Abstracts Views on Vision4Press platform.
Data correspond to usage on the plateform after 2015. The current usage metrics is available 48-96 hours after online publication and is updated daily on week days.
Initial download of the metrics may take a while.