Fig. 1.
Download original image
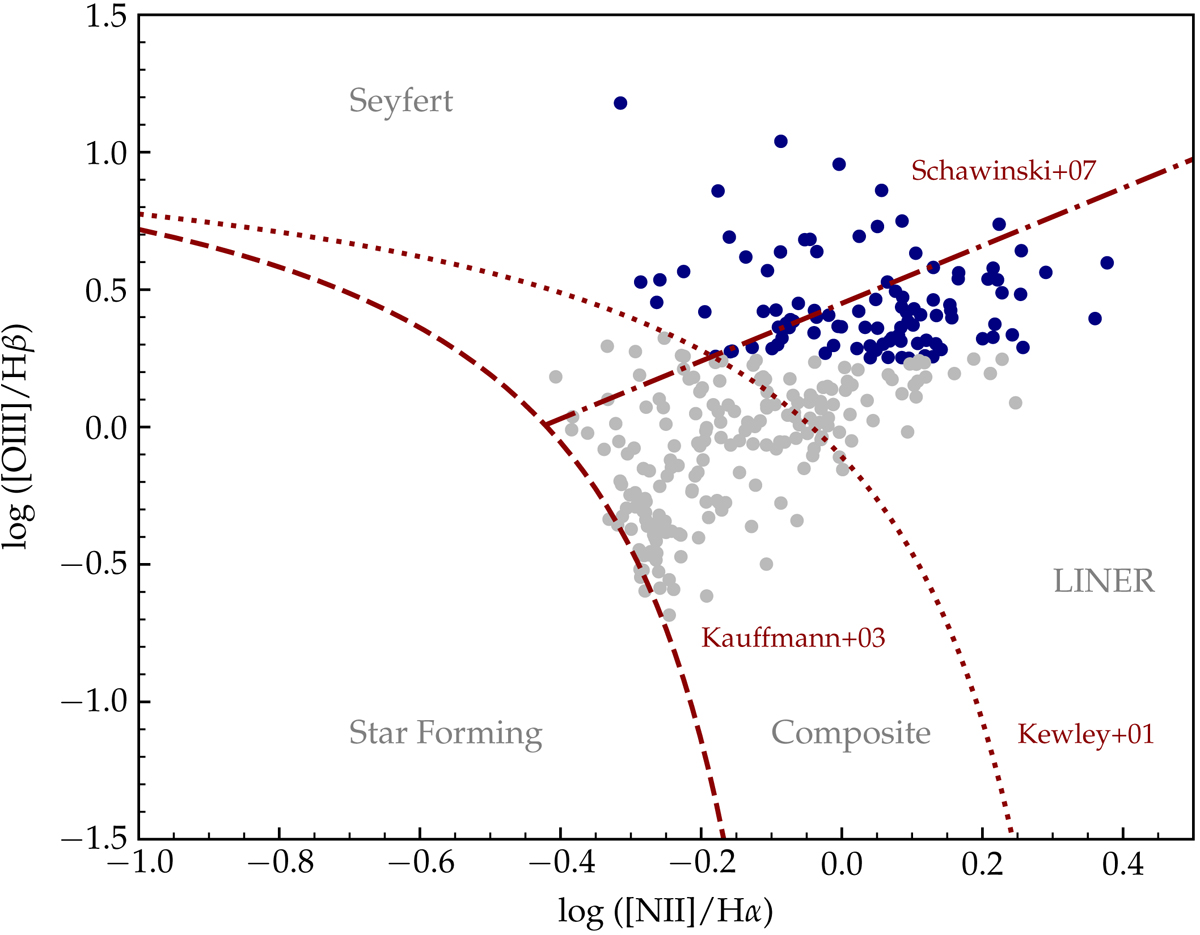
BPT diagram (Baldwin et al. 1981) for classification of objects with respect to their activity. The classification is obtained given the location of the objects in the diagram. The regions are marked according to the curves defined by Kewley et al. (2001), Kauffmann et al. (2003), and Schawinski et al. (2007) which are indicated in the diagram. The line ratios are described in Kauffmann et al. (2003).
Current usage metrics show cumulative count of Article Views (full-text article views including HTML views, PDF and ePub downloads, according to the available data) and Abstracts Views on Vision4Press platform.
Data correspond to usage on the plateform after 2015. The current usage metrics is available 48-96 hours after online publication and is updated daily on week days.
Initial download of the metrics may take a while.