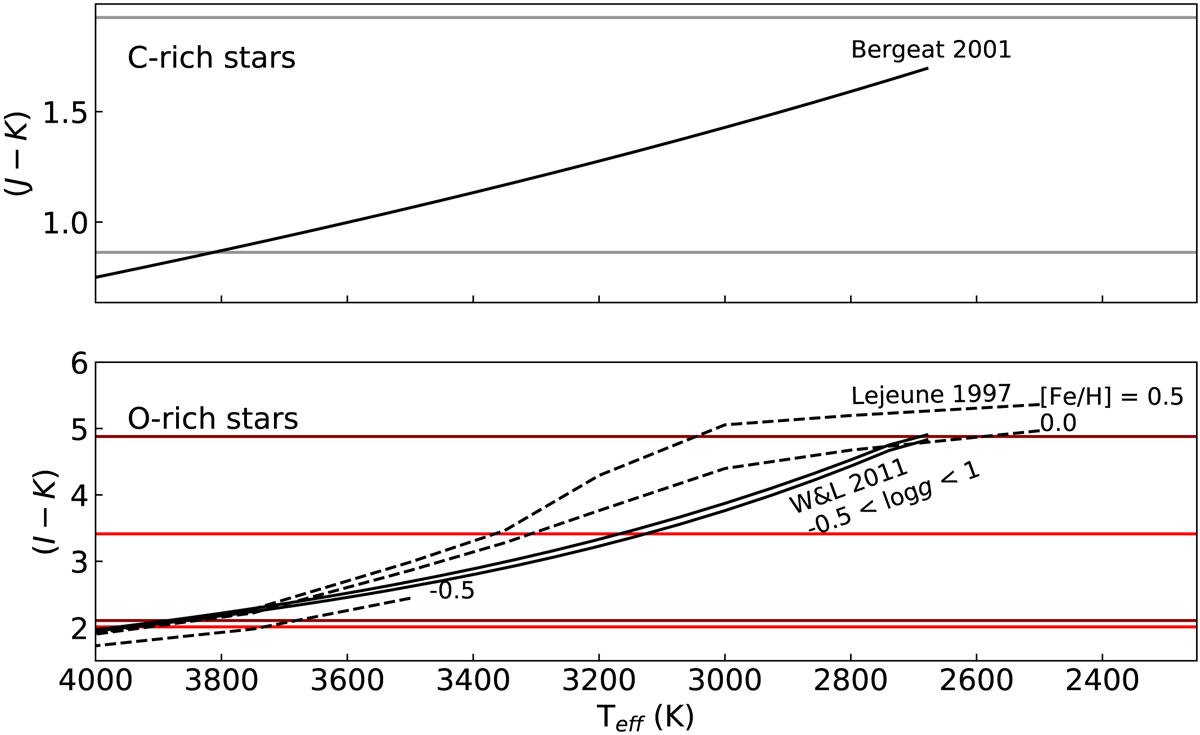
Fig. 15.
Download original image
Colour–temperature relations for C-rich and O-rich stars. The grey horizontal lines (upper panel) represent the colours of the bluest and reddest average spectra on the C-rich TP-AGB sequence. The horizontal red and dark red lines represent the bluest and reddest spectra from the O-rich static and O-rich TP-AGB sequences, respectively.
Current usage metrics show cumulative count of Article Views (full-text article views including HTML views, PDF and ePub downloads, according to the available data) and Abstracts Views on Vision4Press platform.
Data correspond to usage on the plateform after 2015. The current usage metrics is available 48-96 hours after online publication and is updated daily on week days.
Initial download of the metrics may take a while.