Fig. 12.
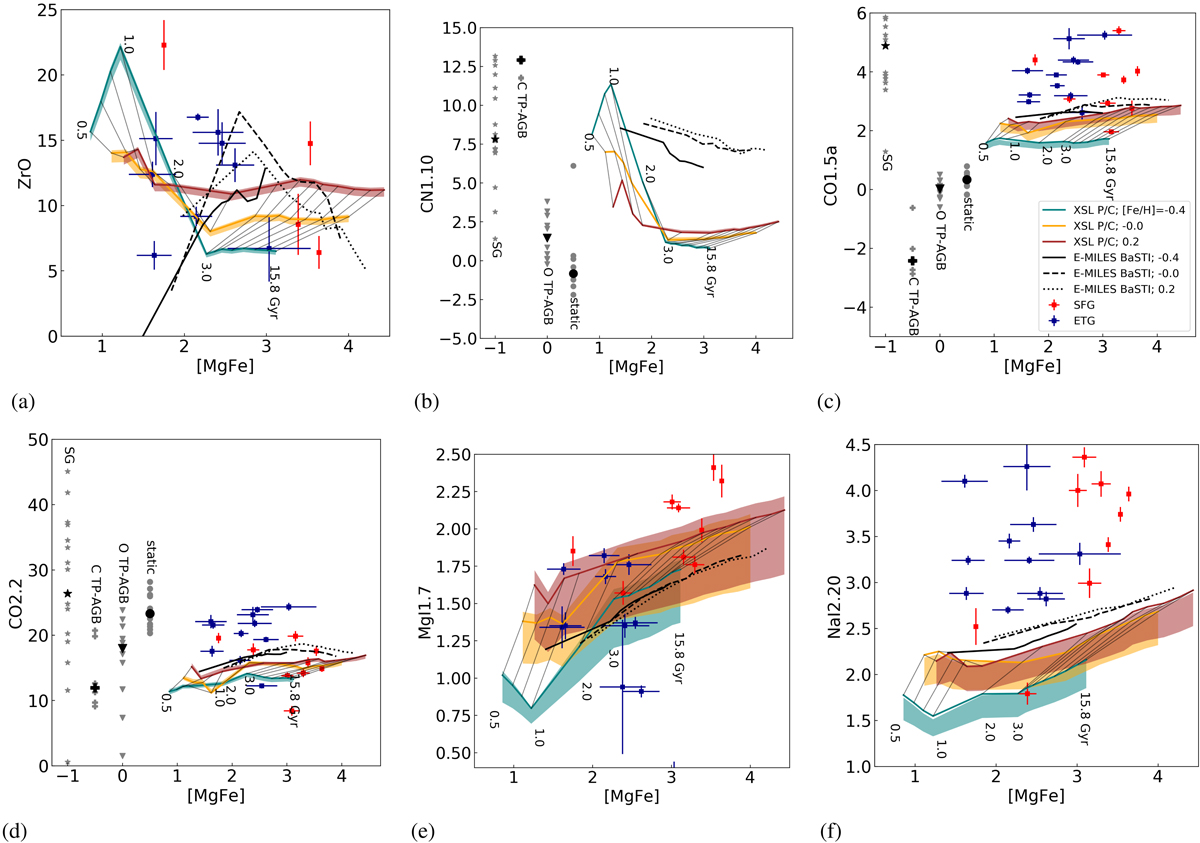
Download original image
Selected index–index comparisons from Riffel et al. (2019). Shaded areas represent XSL PARSEC/COLIBRI SSP model predictions, with red, yellow, and teal indicating [Fe/H] = +0.2, 0.0, and −0.40 dex, respectively. Shaded areas represent models with a spectral resolution of σ = 16 km s−1 (the native XSL resolution) to σ = 228 km s−1 (the resolution of the Riffel et al. 2019 spectra) centred on σ = 60 km s−1 (the E-MILES NIR resolution). Black lines represent E-MILES BaSTI model predictions, with dotted, dashed, and solid lines representing [Fe/H] = +0.26, 0.06, and −0.35 dex, respectively (roughly the same metallicities as the XSL models). We note that the age range differs for the E-MILES models as the NIR spectra of E-MILES are only reliable above 1 Gyr. Panel b: the CN1.10* (Röck 2015) index definition is used instead of the Riffel et al. (2019) definition, which is affected by residuals from telluric absorption correction. We omitted the SFG and ETG measurements of CN1.1 due to differences in index definitions. Panels b–d: XSL static sequences, O-rich TP-AGB sequences, C-rich TP-AGB sequences, and XSL supergiants (which are not included in the XSL SSP models) are shown in grey at arbitrary optical index values (as these stars lack optical features) and their median values with larger black symbols. Indices of SFGs are marked in blue and indices of ETGs in red. These values are taken from Tables 6–7 and B1–B3 of Riffel et al. (2019), respectively.
Current usage metrics show cumulative count of Article Views (full-text article views including HTML views, PDF and ePub downloads, according to the available data) and Abstracts Views on Vision4Press platform.
Data correspond to usage on the plateform after 2015. The current usage metrics is available 48-96 hours after online publication and is updated daily on week days.
Initial download of the metrics may take a while.