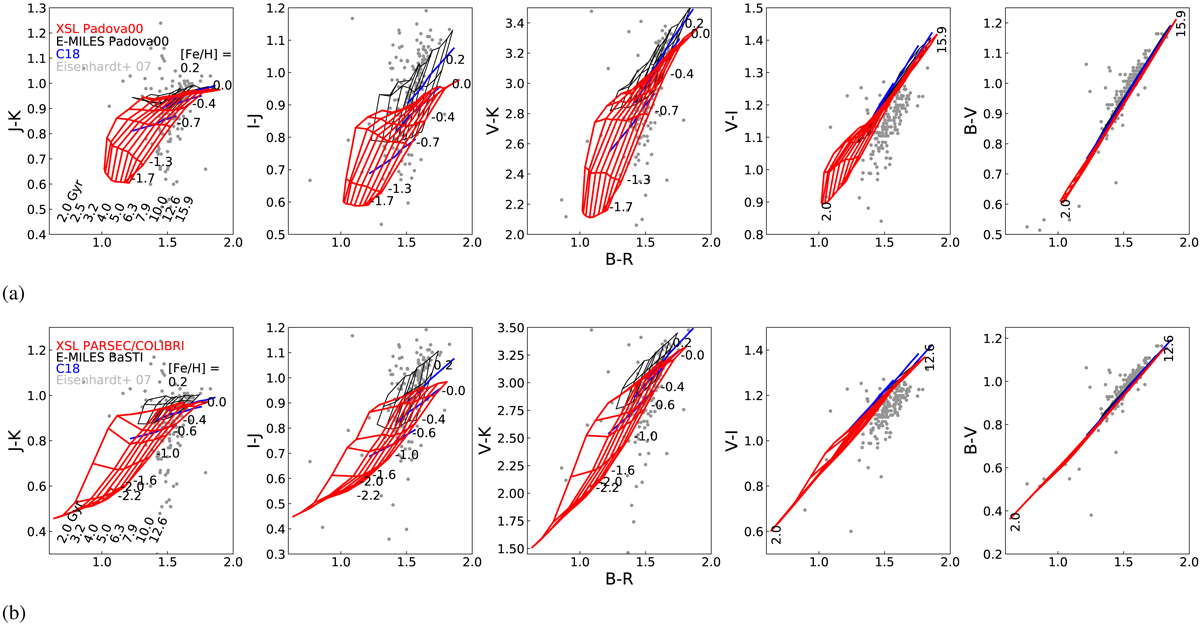
Fig. 11.
Download original image
Colour–colour diagrams of galaxies in the Coma cluster with model predictions overlaid. Grey points show the Eisenhardt et al. (2007) data for galaxies in the Coma cluster. Panel a: XSL and E-MILES Padova00 models. (b) XSL PARSEC/COLIBRI and E-MILES BaSTI models. Only [Fe/H] = +0.2, 0.0, and −0.4 dex E-MILES models are shown. C18 models with [Fe/H] = +0.2, 0.0, and −0.5 dex models are denoted by solid blue lines. XSL models extend to even lower metallicities.
Current usage metrics show cumulative count of Article Views (full-text article views including HTML views, PDF and ePub downloads, according to the available data) and Abstracts Views on Vision4Press platform.
Data correspond to usage on the plateform after 2015. The current usage metrics is available 48-96 hours after online publication and is updated daily on week days.
Initial download of the metrics may take a while.