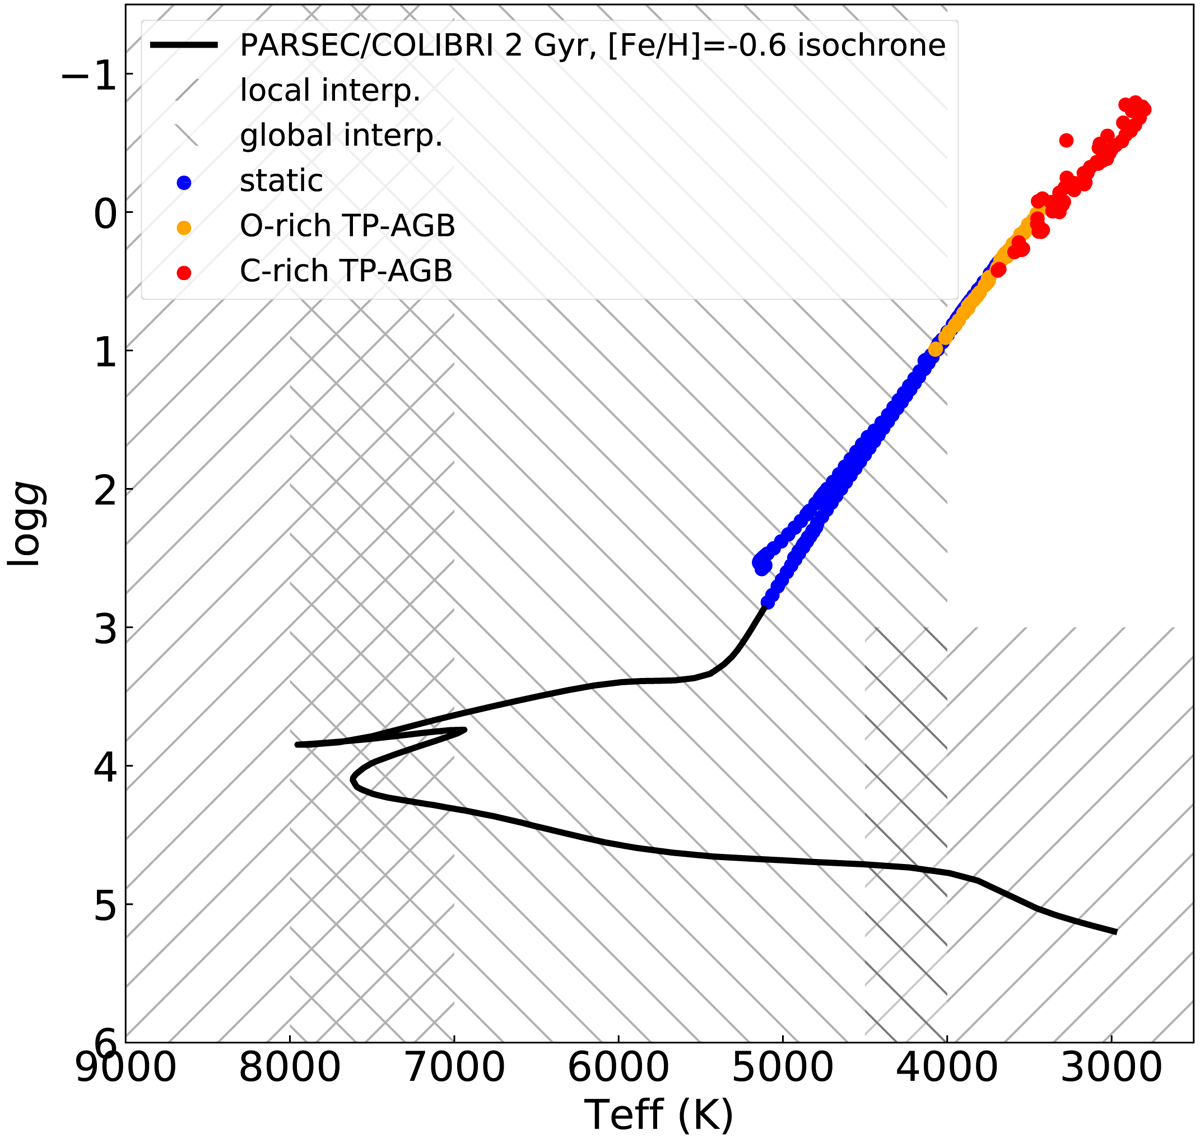
Fig. 1.
Download original image
2 Gyr, [Fe/H] = −0.6 PARSEC/COLIBRI isochrone and the locations on the HR diagram where spectra are generated by local interpolation, global interpolation, or potentially taken from the ‘static’ giant, O-rich TP-AGB, or C-rich TP-AGB sequences. We only switch to the respective sequences when we have reached the bluest average spectrum on that sequence (according to the colour–temperature relation). For example, only the coolest RGB stars (Teff ⪅ 4000 K) are represented by a spectrum originating from the static sequence, and the spectra of warmer RGB stars are created by the global interpolator.
Current usage metrics show cumulative count of Article Views (full-text article views including HTML views, PDF and ePub downloads, according to the available data) and Abstracts Views on Vision4Press platform.
Data correspond to usage on the plateform after 2015. The current usage metrics is available 48-96 hours after online publication and is updated daily on week days.
Initial download of the metrics may take a while.