Fig. 4
Download original image
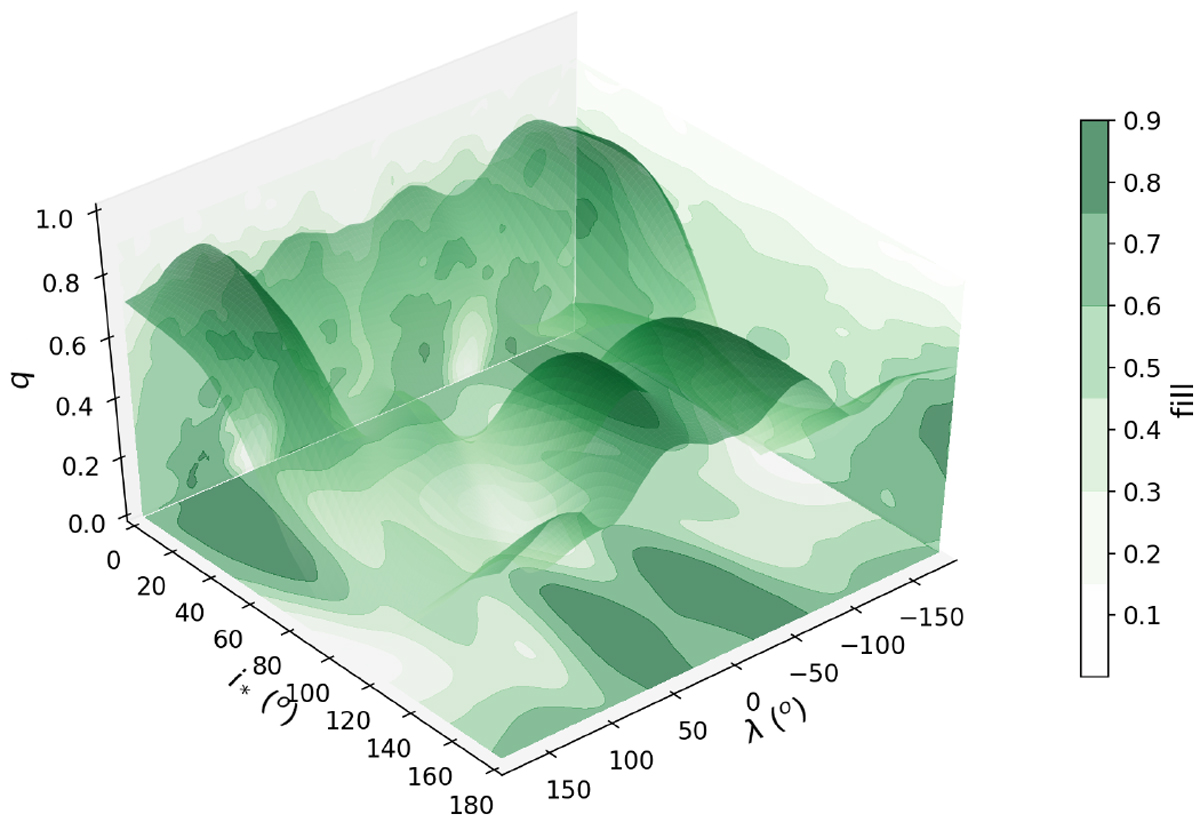
Three-dimensional heat map of the likelihood of detecting DR, α = 0.2. The parameters held constant are listed in Table 1. The 3D surface represents the highest impact parameter at which DR can be retrieved for the corresponding stellar orientation. The structure of the volume below this surface is represented by way of the projections on the respective planes and according to the colour bar. A darker colour indicates a lower preference for DR in the projected area.
Current usage metrics show cumulative count of Article Views (full-text article views including HTML views, PDF and ePub downloads, according to the available data) and Abstracts Views on Vision4Press platform.
Data correspond to usage on the plateform after 2015. The current usage metrics is available 48-96 hours after online publication and is updated daily on week days.
Initial download of the metrics may take a while.