Fig. 2
Download original image
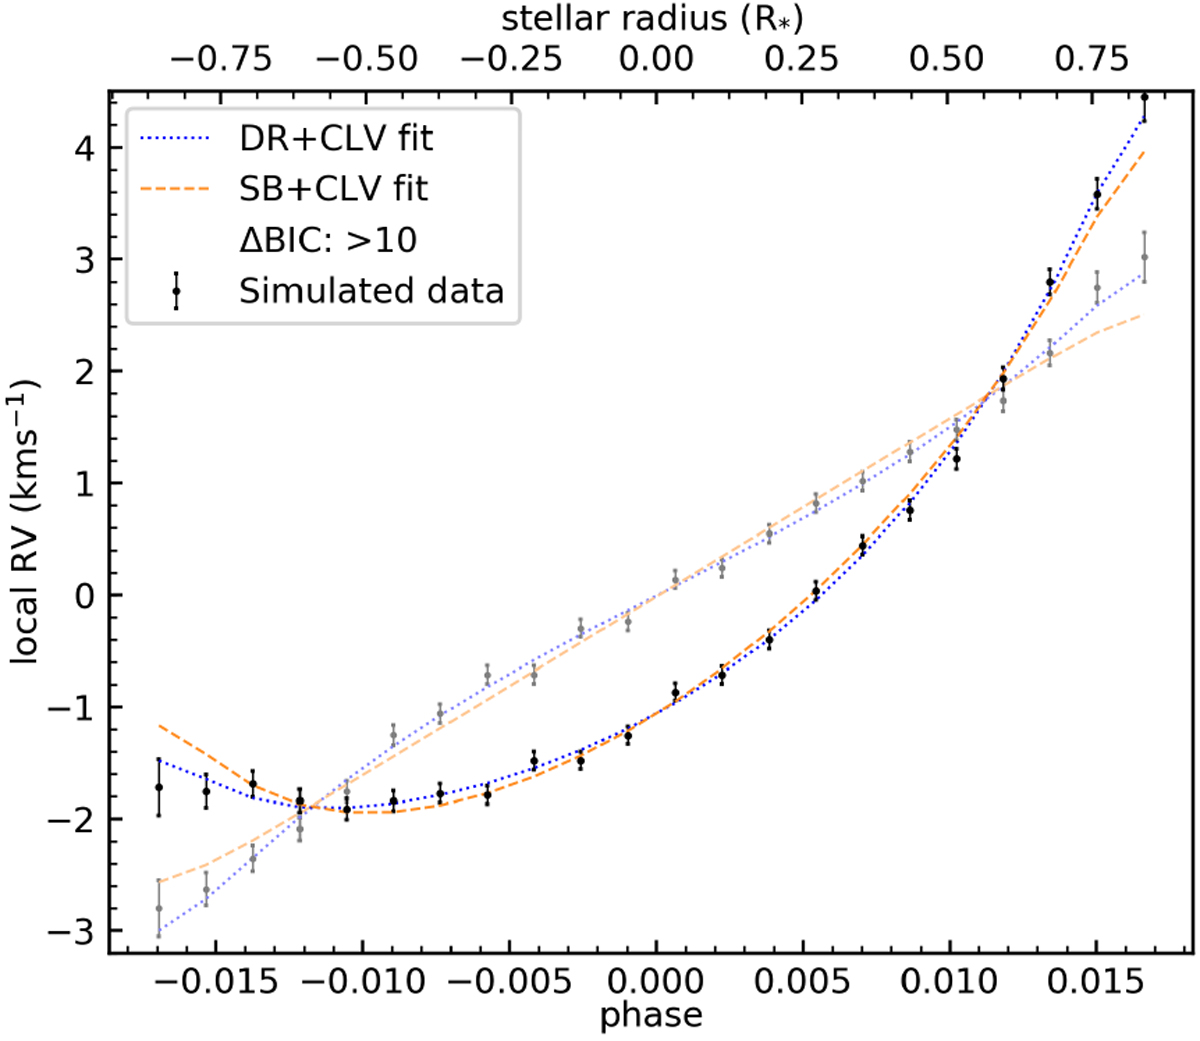
Simulated local stellar surface velocity below the planet along the transit chord as a function of the phase (bottom) and stellar radius (top) for a given star–planet orientation (λ = 0°; i* = 150°; b = 0.2; V = 10), wherein both a solar DR and CLV are injected; compare to Fig. 1 to note the CLV impact (overplotted here in light colours), particularly the relative redshifts near the limbs. The corresponding DR + CLV model fit is shown in blue, and the CLV + SB fit is plotted in orange; a positive BIC indicates a preference for the more complex DR + CLV model.
Current usage metrics show cumulative count of Article Views (full-text article views including HTML views, PDF and ePub downloads, according to the available data) and Abstracts Views on Vision4Press platform.
Data correspond to usage on the plateform after 2015. The current usage metrics is available 48-96 hours after online publication and is updated daily on week days.
Initial download of the metrics may take a while.