Fig. 14
Download original image
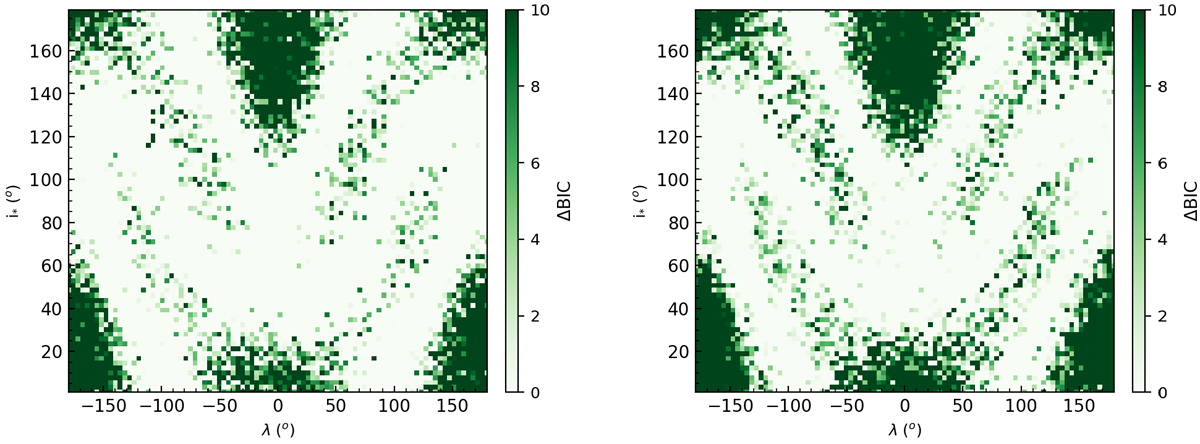
Two-dimensional heat maps of the parameter space (b = 0.5), with the preference for DR + CLV over SB + CLV colour-coded in green for two different sampling rates (left: 100 s, right: 300 s). These results have been obtained with α = 0.2, and the parameters that were held constant across the three figures are listed in Table 1.
Current usage metrics show cumulative count of Article Views (full-text article views including HTML views, PDF and ePub downloads, according to the available data) and Abstracts Views on Vision4Press platform.
Data correspond to usage on the plateform after 2015. The current usage metrics is available 48-96 hours after online publication and is updated daily on week days.
Initial download of the metrics may take a while.