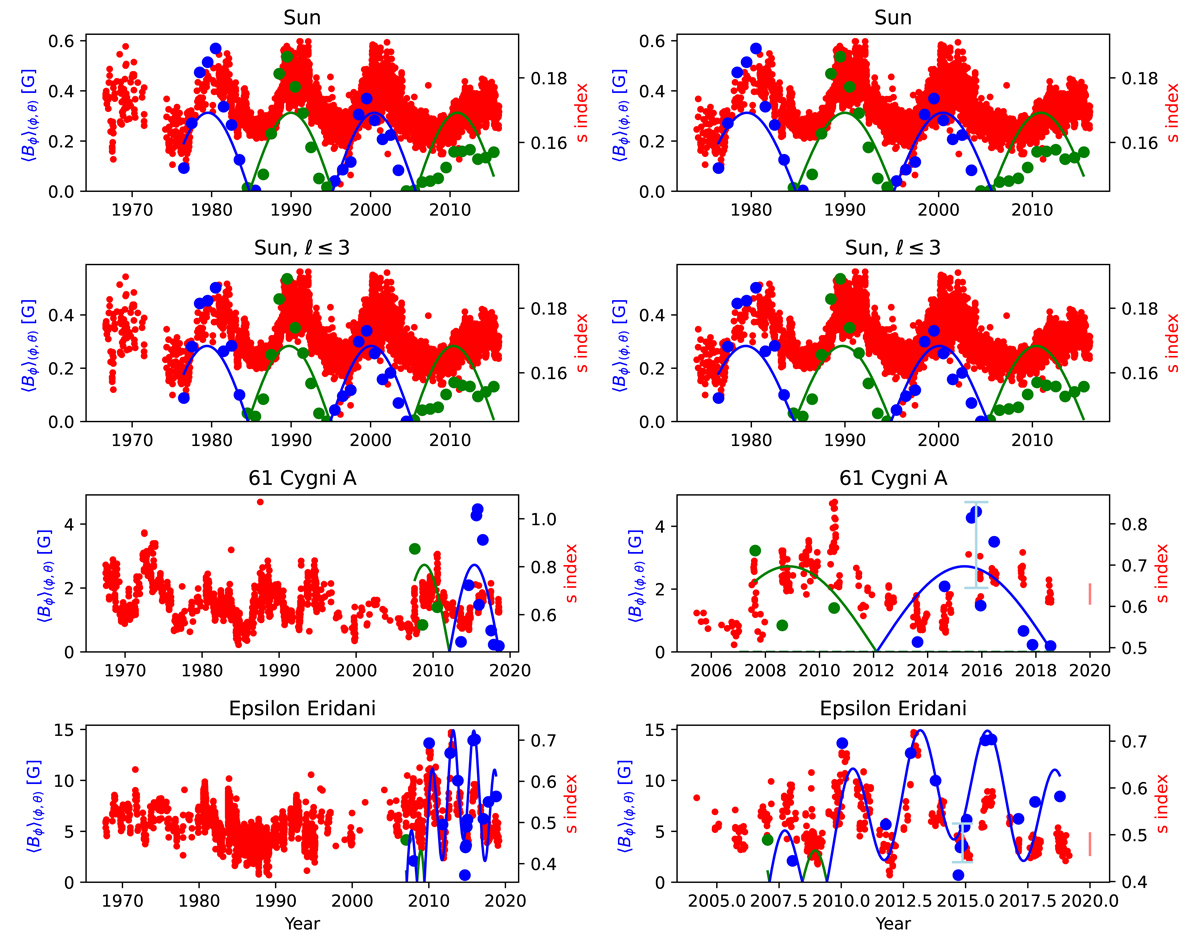
Fig. 3.
Download original image
Time evolution of flux emergence and chromospheric emission: The unsigned latitudinal and longitudinal average of the azimuthal surface magnetic field, ⟨Bϕ⟩(ϕ, θ), is shown in blue and green points indicating where the signed average is negative or positive, respectively. The solid curves are single sinusoidal fits to ⟨Bϕ⟩(ϕ, θ) in the case of the Sun and 61 Cygni A, and a fit using a sum of two sinusoids for ϵ Eridani. The light blue bars indicate the estimated error bars for ⟨Bϕ⟩(ϕ, θ), as described in the text. The independently determined level of chromospheric activity as measured by the S-index is shown with red points and the vertical bar at year 2020 shows the S-index error bar. Top row: Sun at high resolution; Second row: Sun at the equivalent resolution of the ZDI maps; Third and fourth rows: results for 61 Cygni A and ϵ Eridani, respectively. Left panel: extends back to the S-index observations obtained in the 1960s while the right-hand panel zooms into the time period where there are also magnetic maps.
Current usage metrics show cumulative count of Article Views (full-text article views including HTML views, PDF and ePub downloads, according to the available data) and Abstracts Views on Vision4Press platform.
Data correspond to usage on the plateform after 2015. The current usage metrics is available 48-96 hours after online publication and is updated daily on week days.
Initial download of the metrics may take a while.