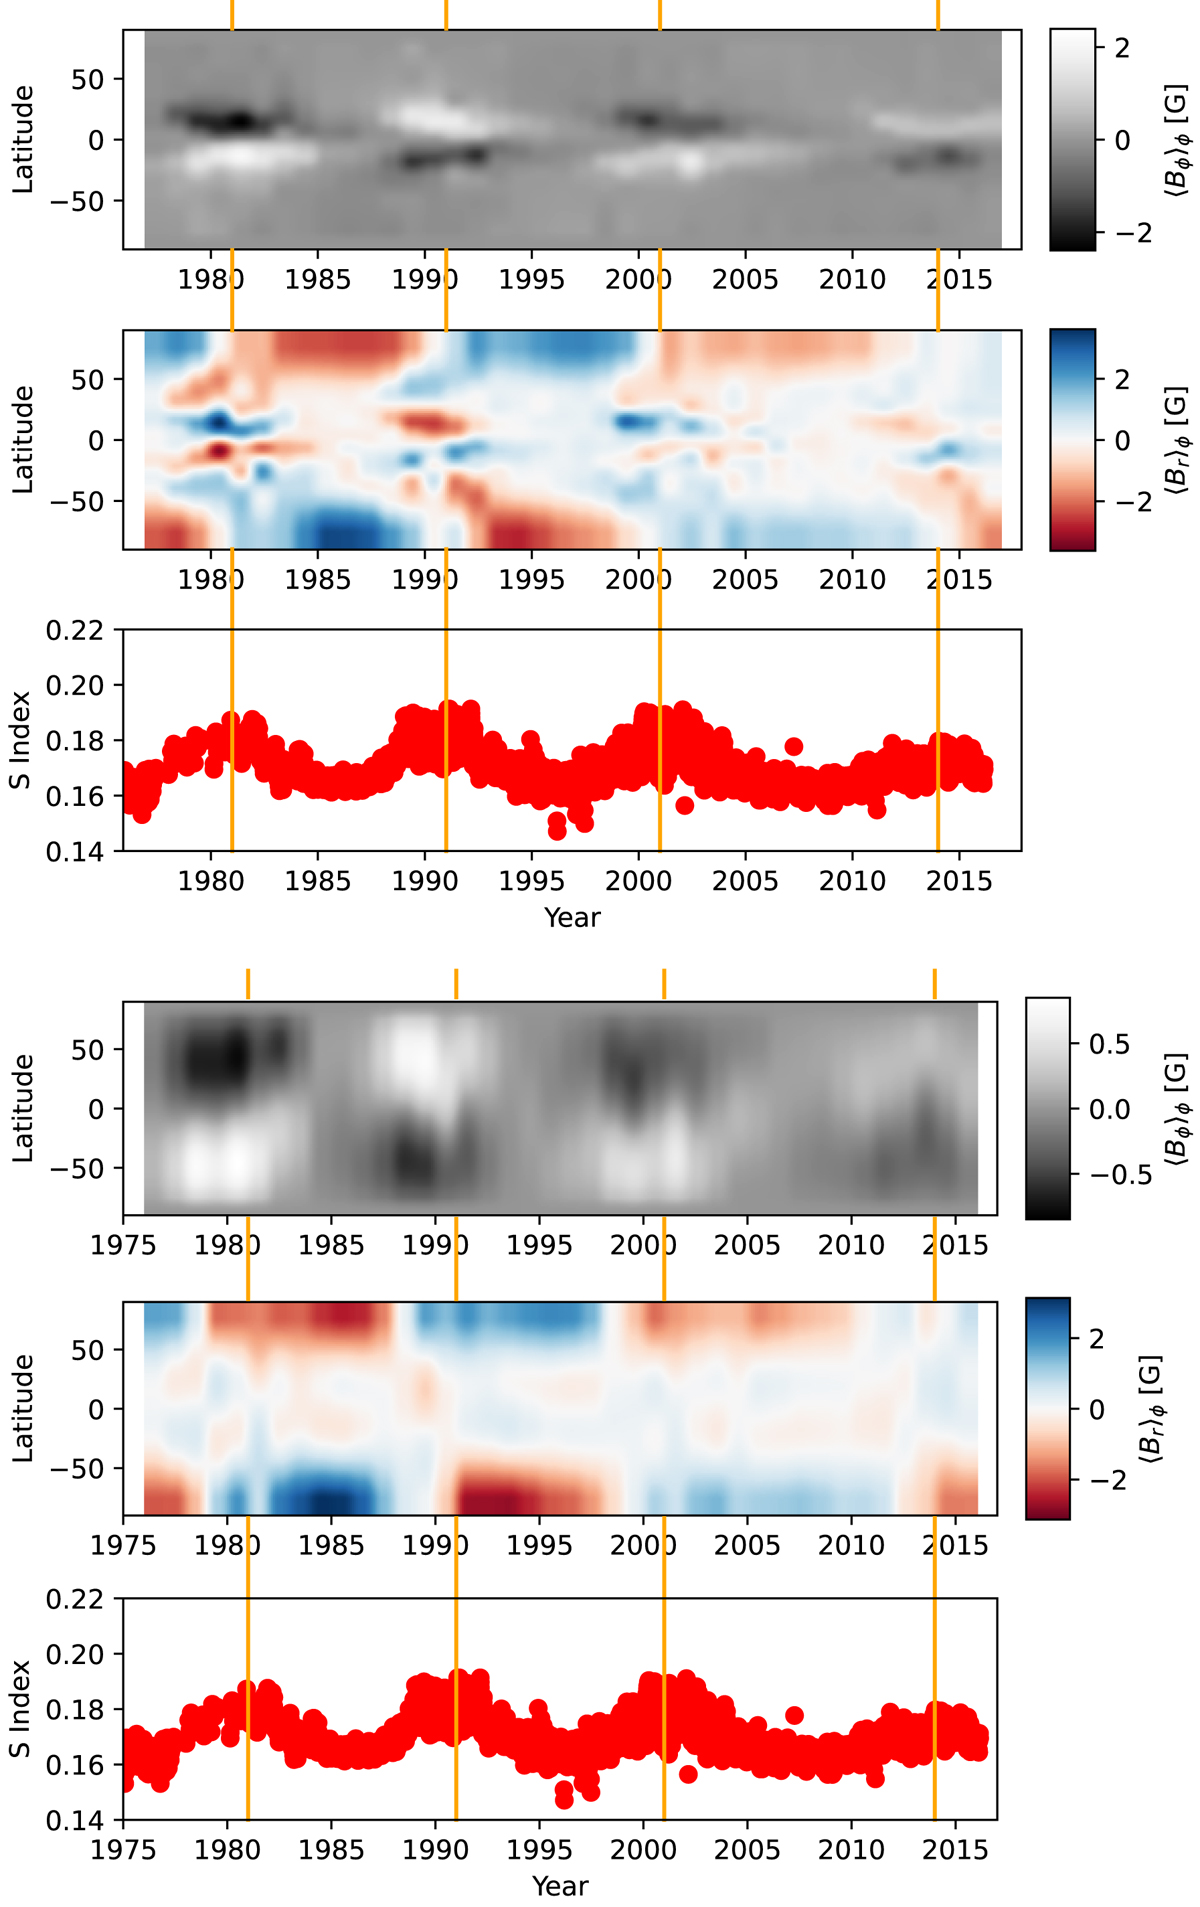
Fig. 1.
Download original image
Solar butterfly diagram from observations secured with the Wilcox Solar Observatory. Top three rows: the following: ⟨Bϕ⟩ϕ, with positive polarity in white and negative polarity in black (top panel); ⟨Br⟩ϕ with positive polarity in red and negative polarity in blue (second panel); and the chromospheric S-index values, where the yellow vertical lines indicate the S-index activity maximum (third panel). Lower three panels: are the same, but with the magnetic maps reduced to a lower resolution matching that achievable for 61 Cygni A and ϵ Eridani.
Current usage metrics show cumulative count of Article Views (full-text article views including HTML views, PDF and ePub downloads, according to the available data) and Abstracts Views on Vision4Press platform.
Data correspond to usage on the plateform after 2015. The current usage metrics is available 48-96 hours after online publication and is updated daily on week days.
Initial download of the metrics may take a while.