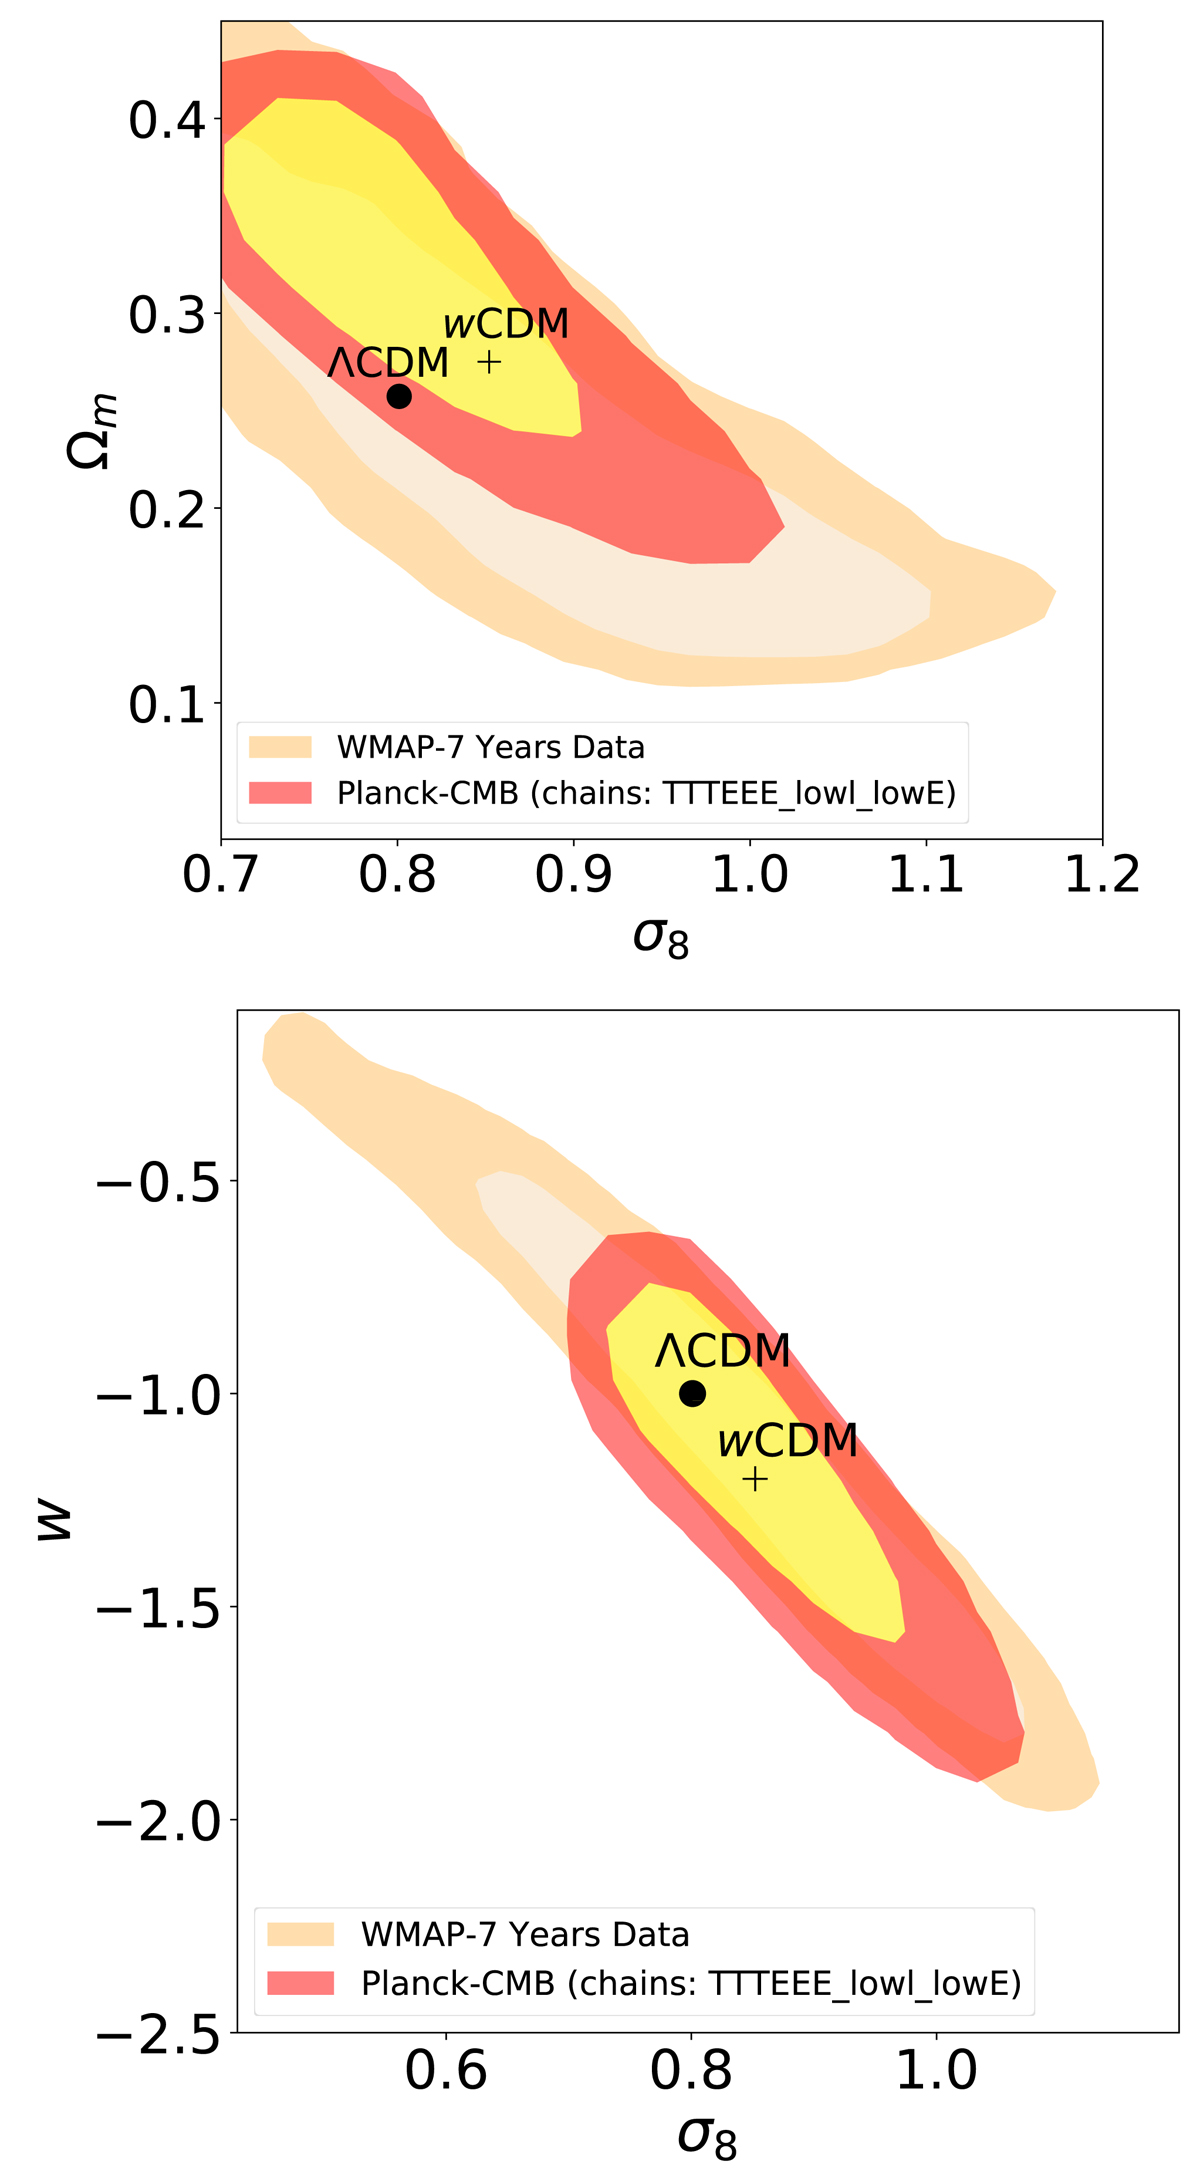
Fig. 1.
Download original image
1 and 2σ credible regions from the WMAP 7 yr data analysis (beige filled contours) and the Planck primary CMB analysis of the TT, TE, and EE anisotropy spectra (Planck Collaboration VI 2020) (red and yellow filled contours). The parameter values of the ΛCDM and wCDM models correspond to the dot and the cross markers, respectively.
Current usage metrics show cumulative count of Article Views (full-text article views including HTML views, PDF and ePub downloads, according to the available data) and Abstracts Views on Vision4Press platform.
Data correspond to usage on the plateform after 2015. The current usage metrics is available 48-96 hours after online publication and is updated daily on week days.
Initial download of the metrics may take a while.