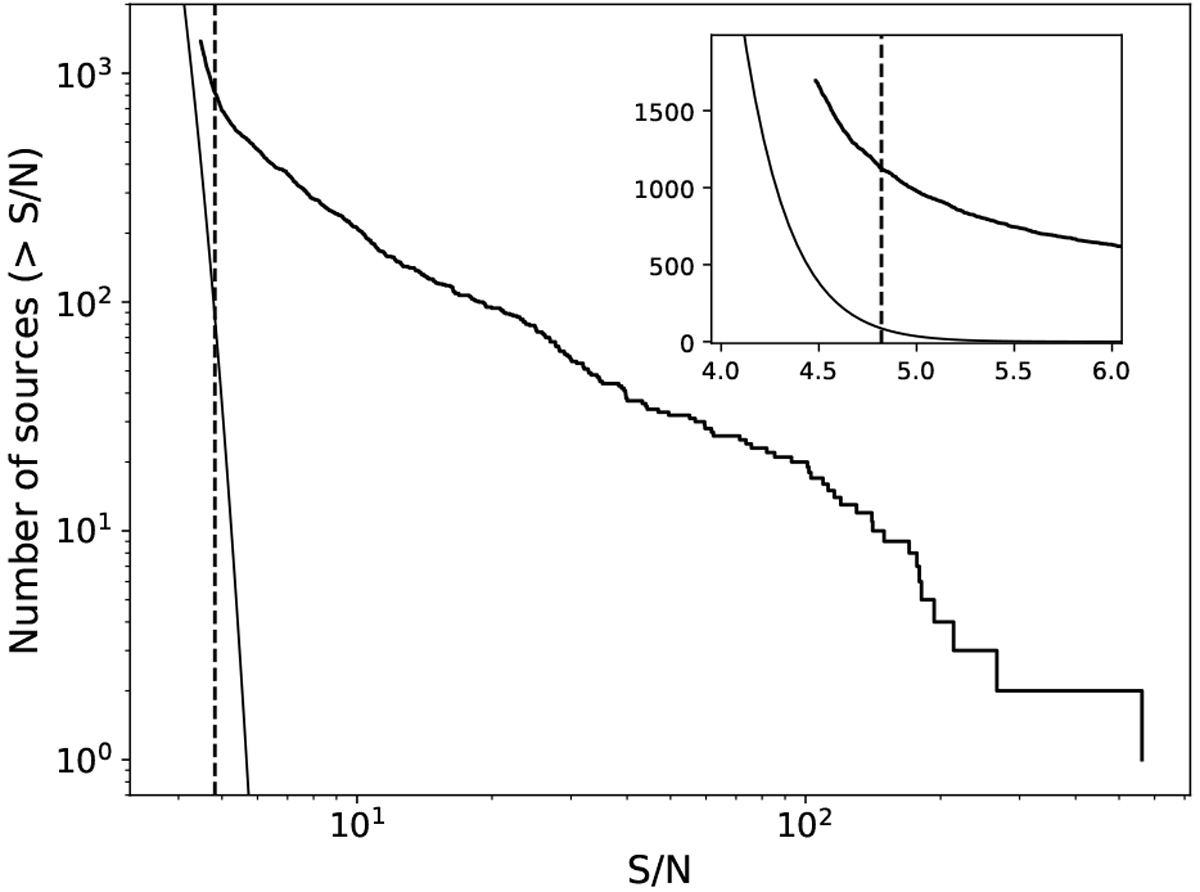
Fig. 5
Download original image
Number of point sources as a function of detection significance in ARTSS12 in the 4–12 keV band (thick solid line). The dashed vertical line indicates the adopted threshold of S/N = 4.82, which corresponds to the expected 10% fraction of spurious sources. The thin solid line shows the expected number of spurious sources as a function of the detection significance. The inset shows a zoom-in near the detection threshold.
Current usage metrics show cumulative count of Article Views (full-text article views including HTML views, PDF and ePub downloads, according to the available data) and Abstracts Views on Vision4Press platform.
Data correspond to usage on the plateform after 2015. The current usage metrics is available 48-96 hours after online publication and is updated daily on week days.
Initial download of the metrics may take a while.