Fig. 6
Download original image
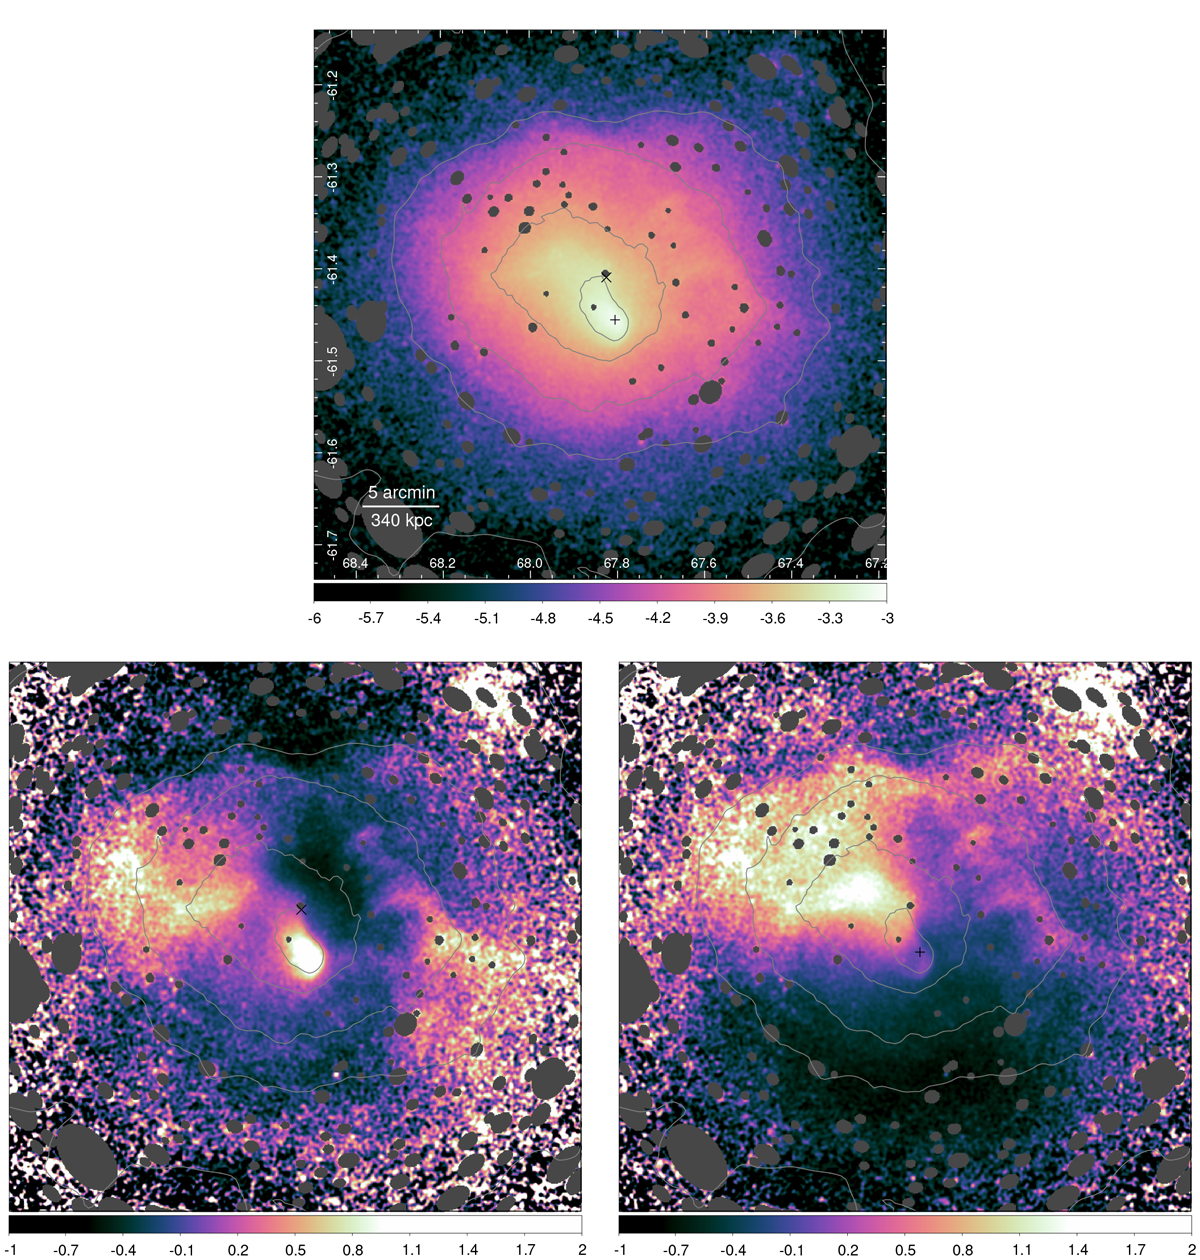
X-ray image (top panel) and fractional residuals (bottom panels). The X-ray image was created in the 0.2–2.3 keV band and is exposure corrected by the effective exposure (relative to on-axis; units log10 counts s−1 pixel−1). The image was smoothed by a Gaussian of σ = 6 arcsec (3 pixels). Point sources were masked before smoothing. Contours are at 5 logarithmic levels between 0.00004 and 0.0019 counts s−1 pixel−1. The residual maps shows the fractional difference from the average at each radius, ignoring masked regions. Two different centres are used: (α = 67.8759°, δ = −61.4214°), marked ×, chosen to lie at the centre of the 4th contour level (bottom left panel), and (α = 67.8060°, δ = −61.4570°), marked +, which is the X-ray centroid within 12 arcmin radius (bottom right panel) and lies very close to the centre used by Ghirardini et al. (2019). When showing the fractional differences later in the paper we will use the hand-chosen centre.
Current usage metrics show cumulative count of Article Views (full-text article views including HTML views, PDF and ePub downloads, according to the available data) and Abstracts Views on Vision4Press platform.
Data correspond to usage on the plateform after 2015. The current usage metrics is available 48-96 hours after online publication and is updated daily on week days.
Initial download of the metrics may take a while.