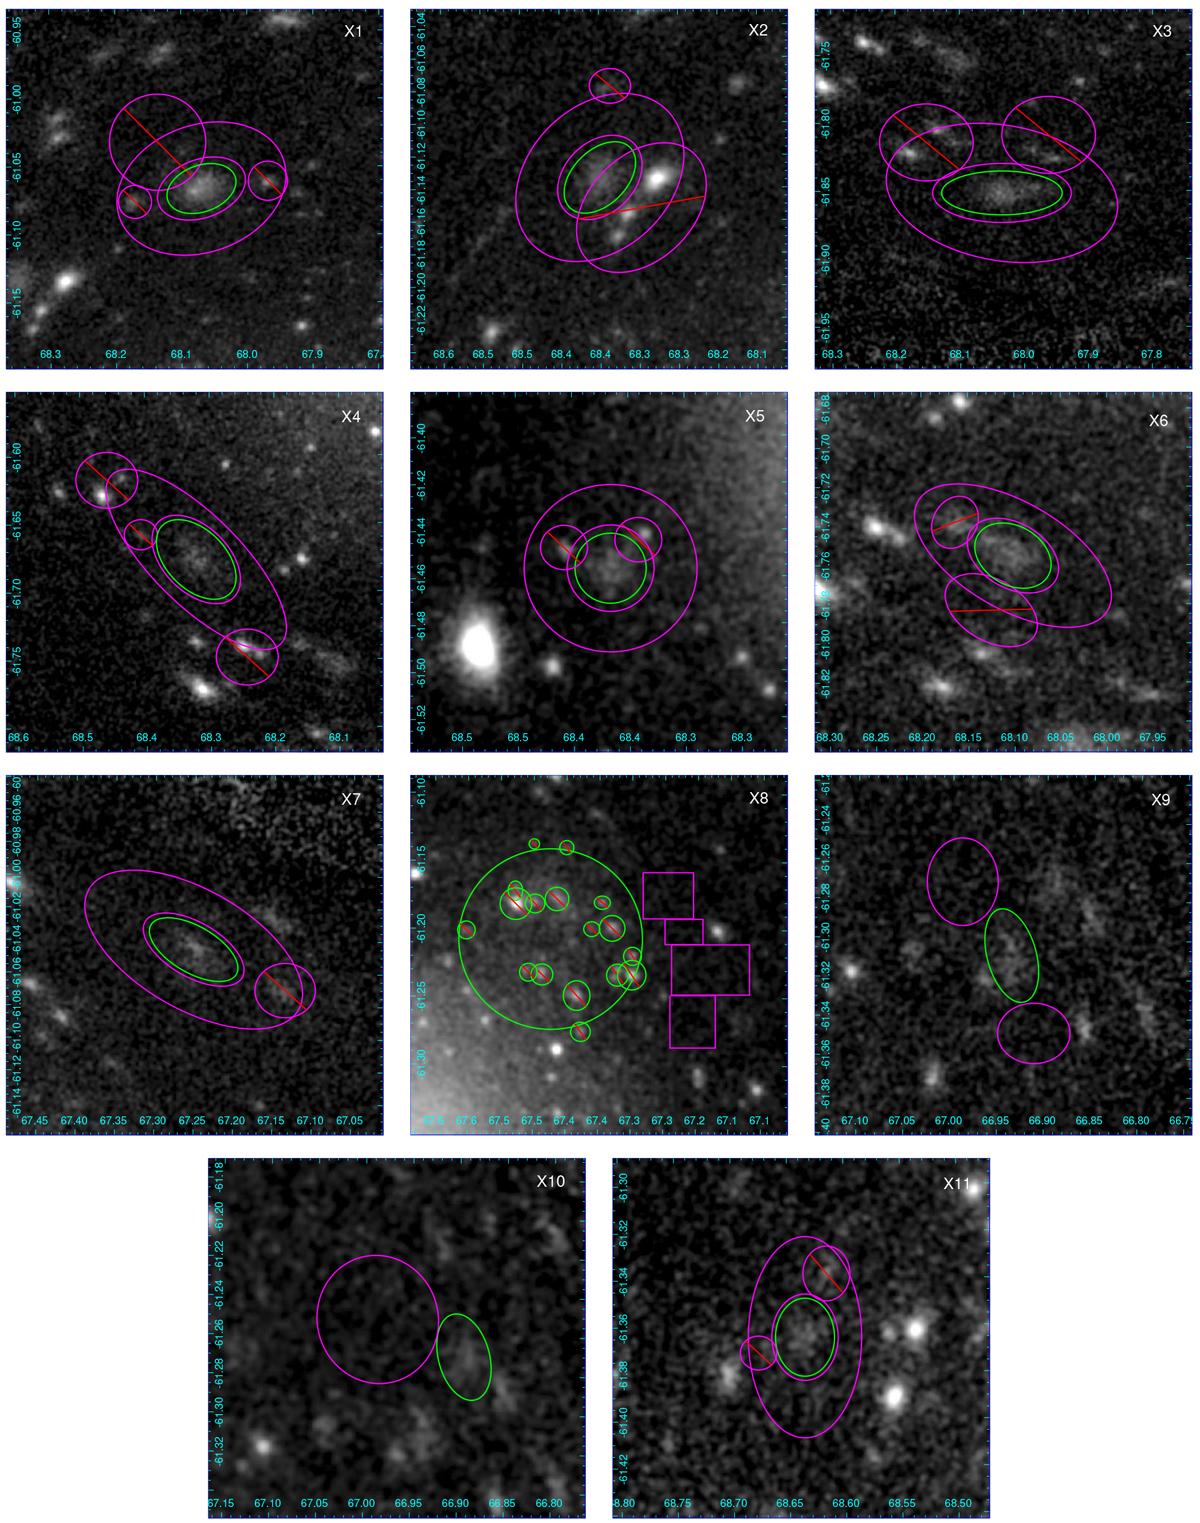
Fig. B.1
Download original image
Extraction regions used for the spectral analysis of the extended sources in the field. The source extraction radius is marked in green, while the background regions are in magenta. Shown are 0.3–2.3 keV exposure-corrected background-subtracted images, with Gaussian smoothing. Excluded regions are marked by a diagonal line.
Current usage metrics show cumulative count of Article Views (full-text article views including HTML views, PDF and ePub downloads, according to the available data) and Abstracts Views on Vision4Press platform.
Data correspond to usage on the plateform after 2015. The current usage metrics is available 48-96 hours after online publication and is updated daily on week days.
Initial download of the metrics may take a while.